
SCHEDULE 14A INFORMATION
PROXY STATEMENT PURSUANT TO SECTION 14(a) OF THE
SECURITIES EXCHANGE ACT OF 1934
Filed by the Registrant [X]
Check the appropriate box
| ☐ | Preliminary Proxy Statement |
| ☐ | Confidential, for Use of the Commission Only (as permitted by Rule 14a-6(e)(2)) |
| ☒ | Definitive Proxy Statement |
| ☐ | Definitive Additional Materials |
| ☐ | Soliciting Material Pursuant to Section 240.14a-12 |
ALEXANDER & BALDWIN, INC.
(Name of Registrant as Specified in its Charter)
Payment of Filing Fee (Check the appropriate box):
| No fee required. | ||||
| Fee computed on table below per Exchange Act Rules 14a-6(i)(1) and 0-11. | ||||
| (1) | Title of each class of securities to which transaction applies: | |||
| (2) | Aggregate number of securities to which transaction applies: |
| (3) | Per unit price or other underlying value of transaction computed pursuant to Exchange Act Rule 0-11 (Set forth the amount on which the filing fee is calculated and state how it was determined): |
| (4) | Proposed maximum aggregate value of transaction: |
| (5) | Total fee paid: | |||
| Fee paid previously with preliminary materials. | |||
| Check box if any part of the fee is offset as provided by Exchange Act Rule 0-11(a)(2) and identify the filing for which the offsetting fee was paid previously. Identify the previous filing by registration statement number, or the Form or Schedule and the date of its filing. | ||||
| (1) | Amount Previously Paid: | |||
| (2) | Form, Schedule or Registration Statement No.: |
| (3) | Filing Party: | |||
| (4) | Date Filed: |

822 Bishop Street, Honolulu, Hawaii 96813
March 14, 2016
To the Shareholders of Alexander & Baldwin, Inc.:
You are invited to attend the 20162017 Annual Meeting of Shareholders of Alexander & Baldwin, Inc., to be held at A&B headquarters, 822 Bishop Street,the Pomaikai Ballroom, Dole Cannery, 735 Iwilei Road, Honolulu, Hawaii, on Tuesday, April 26, 201625, 2017 at 8:00 a.m. We look forward to the opportunity to meet with you.
Whether or not you now plan to attend the Annual Meeting, please vote as soon as possible.
You may vote via the Internet, by telephone or by requesting a paper proxy card to complete and return by mail. Specific instructions for shareholders are included in the enclosed proxy or on a Notice of Internet Availability of Proxy Materials being distributed to shareholders on or around MarchYour vote is important and your shares should be represented. Thank you for your continued support of A&B.
| Sincerely, | ||
 | ||
| CHRISTOPHER J. BENJAMIN | ||
| President and Chief Executive Officer | ||

822 Bishop Street, Honolulu, Hawaii 96813
The Annual Meeting of Shareholders of Alexander & Baldwin, Inc. will be held at A&B headquarters at 822 Bishop Street,the Pomaikai Ballroom, Dole Cannery, 735 Iwilei Road, Honolulu, Hawaii, on Tuesday, April 26, 2016,25, 2017, at 8:00 a.m., Honolulu time, to:
| 1. | Elect |
| 2. | Conduct an advisory vote on executive compensation; |
| 3. | Ratify the appointment of the independent registered public accounting firm for the ensuing year; and |
| 4. | Transact such other business as properly may be brought before the meeting or any adjournment or postponement thereof. |
The Board of Directors has set the close of business on February 18, 201616, 2017 as the record date for the meeting. Owners of Alexander & Baldwin, Inc. stock at the close of business on that date are entitled to receive notice of and to vote at the meeting. Shareholders will be asked at the meeting to present valid photo identification. Shareholders holding stock in brokerage accounts must present a copy of a brokerage statement reflecting stock ownership as of the record date.
IT IS IMPORTANT THAT YOUR SHARES BE REPRESENTED AT THE MEETING. PLEASE PROMPTLY VOTE VIA THE INTERNET OR BY TELEPHONE, OR REQUEST A PAPER PROXY CARD TO COMPLETE AND RETURN BY MAIL.
| By Order of the Board of Directors, |
 |
| ALYSON J. NAKAMURA |
| Corporate Secretary and Assistant General Counsel |
March 14, 2016
i
To assist you in reviewing this Proxy Statement, we would like to call your attention to key elements of this document. The following description is only a summary. For more information, please read the complete Proxy Statement. ANNUAL MEETING OF SHAREHOLDERSSUMMARY INFORMATIONTime and Date: Tuesday, April 26, 2016, 8:00 a.m. HSTPlace: A&B Headquarters822 Bishop StreetHonolulu, Hawaii 96813Record Date: February 18, 2016Voting: Shareholders as of the record date are entitled to vote.
| Time and Date: | Tuesday, April 25, 2017, 8:00 a.m. HST | |
| Place: | Pomaikai Ballroom | |
| Dole Cannery | ||
| 735 Iwilei Road | ||
| Honolulu, Hawaii | ||
| Record Date: | February 16, 2017 | |
| Voting: | Shareholders as of the record date are entitled to vote. | |
| Admission: | Shareholders will be asked to present valid photo identification. Shareholders holding | |
| stock in brokerage accounts must present a copy of a brokerage statement reflecting stock | ||
| ownership as of the record date. |
MEETING AGENDA
Agenda Item | Board Recommendation | Page Reference | ||
Election of | FOR each director nominee | 2 | ||
Advisory vote on executive compensation | FOR | 46 | ||
Ratification of appointment of Deloitte & Touche LLP as our independent registered public accounting firm | FOR | 47 |
BOARD NOMINEES
The following table provides summary information about each director nominee. Each director nominee is elected for a three-year term.
Name | Director | Occupation | Committees | |||
| W. Allen Doane | 2012 | Retired Chairman of the Board and CEO of A&B Predecessor | • Leadership • Real Estate • Finance | |||
Chairman of the Board and President, Royal Contracting Co., Ltd. Retired CEO of Grace Pacific LLC, a wholly-owned subsidiary of A&B | • Leadership • Construction • Finance | |||||
| 2012 | Chairman | • | ||||
| Leadership • | ||||||
| Real Estate • | ||||||
ii
EXECUTIVE COMPENSATION LINKED TO PERFORMANCE
All elements of executive compensation are generally targeted at the 50
We encourage you to read our Compensation Discussion and Analysis (“CD&A”), which begins on page 1920 and describes our pay for performance philosophy and each element of compensation. Our Board of Directors recommends approval, on an advisory basis, of the compensation of our Named Executive Officers, as further described in the CD&A and “Proposal No. 2: Advisory Vote on Executive Compensation” beginning on page 43.
iii
Certain Information Regarding Directors and Executive Officers Proposal No. 3: Ratification of Appointment of Independent Registered Public Accounting FirmTABLE OF CONTENTSPage i ii 1 2 2 89 89 89 9 910 10 1112 1213 1213 1213 13 13 1516 1516 1516 1617 1617 1618 1618 1920 1920 3234 3234 3335 3436 3537 3638 3738 3840 3840 44 4346 4447 4547 4649
822 Bishop Street, Honolulu, Hawaii 96813
PROXY STATEMENT
Why am I receiving these materials?
The Board of Directors of Alexander & Baldwin, Inc. (“A&B” or the “Company”) is soliciting proxies for the Annual Meeting of Shareholders to be held on April 26, 201625, 2017 and at any adjournment or postponement of the meeting (the “Annual Meeting”).
Why did I receive a notice in the mail regarding the Internet availability of the proxy materials instead of a paper copy of the full set of proxy materials?
On or around March 14, 2016,13, 2017, we mailed to our shareholders (other than to certain street name shareholders or those who previously requested electronic or paper delivery) a Notice of Internet Availability of Proxy Materials, which contains instructions for accessing and reviewing on the Internet all of our proxy materials, including this Proxy Statement and our 20152016 Annual Report to Shareholders. In accordance with rules and regulations adopted by the U.S. Securities and Exchange Commission (“SEC”), instead of mailing a printed copy of our proxy materials to each shareholder of record, we are furnishing proxy materials on the Internet. This process is designed to expedite shareholders'shareholders’ receipt of proxy materials, lower the cost of the Annual Meeting and help conserve natural resources.
How can I request a paper copy of these materials?
You will not receive a printed copy of the proxy materials unless you request it. If you would prefer to receive printed proxy materials, please follow the instructions for requesting such materials contained in the Notice of Internet Availability of Proxy Materials. This process is designed to expedite shareholders'shareholders’ receipt of proxy materials, lower the cost of the Annual Meeting and help conserve natural resources.
Can I vote using the Internet?
The Notice of Internet Availability of Proxy Materials also provides instructions for voting your proxy on the Internet.
Who is entitled to vote at the Annual Meeting?
Shareholders of record at the close of business on February 18, 201616, 2017 are entitled to notice of and to vote at the Annual Meeting. On that date, there were 48,954,24249,081,500 shares of common stock outstanding, each of which is entitled to one vote.
What is the voting requirement to approve each of the proposals?
Provided a quorum is present, a majority of the votes cast will be necessary for the ratification of the appointment of the independent registered public accounting firm and for the approval, on an advisory basis, of our executive compensation. Directors are elected by a plurality of votes cast, provided a quorum is present; provided, however, that any director nominee who receives a greater number of withhold votes than affirmative votes in an uncontested election will promptly submit his or her resignation for consideration by the Nominating and Corporate Governance Committee and the Board, as described further in the Company’s Corporate Governance Guidelines.
What effect do abstentions and broker non-votes have on the proposals?
Abstentions and brokernon-votes will be included for purposes of establishing a quorum at the Annual Meeting. However, abstentions and brokernon-votes will have no effect on the voting results for any matter, as they are not considered to be votes cast.
Who will bear the cost of soliciting votes for the Annual Meeting?
Officers, employees and directors of A&B and its subsidiaries may, without additional compensation, solicit proxies by telephone or by other appropriate means. Arrangements also will be made with brokerage firms and other persons that are record holders of A&B’s common stock to forward proxy soliciting material to the beneficial owners of the stock, and A&B will reimburse those record holders for their reasonable expenses. A&B has retained the firm of Morrow & Co., Inc.Sodali Global, LLC to assist in the solicitation of proxies at a cost of $10,000 plus reasonableout-of-pocket expenses.
May I change my vote or revoke my proxy?
You may revoke your proxy or change your vote any time before it is voted at the Annual Meeting by:
When were the Proxy Statement materials made publicly available?
This Proxy Statement and the enclosed proxy are being mailed to shareholders and are being made available on the Internet at www.alexanderbaldwin.com, on or about March 14, 2016.
Who can I contact to obtain directions to the Annual Meeting site?
You may contact Stacy Mercado at (808)525-6661 to obtain directions to the site of the Annual Meeting, 822 Bishop Street,Pomaikai Ballroom, Dole Cannery, 735 Iwilei Road, Honolulu, HI.
What do the references to the term “A&B Predecessor” mean in this document?
References in this Proxy Statement to “A&B Predecessor” mean Alexander & Baldwin, Inc. prior to its separation from Matson, Inc. on June 29, 2012.
Three Class III Directors will be elected at the Annual Meeting to serve a three-year term and until their successors are duly elected and qualified.
The following table provides the name, age (as of March 31, 2016)2017), and principal occupation of each person nominated by the A&B Board and each director continuing in office, their business experience during at least the last five years, the year each first was elected or appointed a director and qualifications of each director.
Our Nominating Committee is focused on creating a Board that consists of members that have a diversity of professional experience and a combined skill set to help oversee our business effectively. The Board weighs the alignment of Board capabilities with the needs of A&B as part of the Board’s self-assessment process. The Nominating Committee’s processes for selecting director nominees are described in greater detail in “Certain Information Concerning the Board of Directors – Nominating Committee Processes” below.
Our Board members have a diverse range of perspectives and are knowledgeable about our businesses. Each director contributes in establishing a board climate of trust and respect, where deliberations are open and constructive. A&B’s business strategy is Hawaii-focused and, accordingly, the Board believes it is valuable to shareholders that the vastgreat majority of our directors isbe Hawaii-based executives who can provide extensive local knowledge and insight.
Skills Aligned with Board Needs
Strong combined skillset* and local Hawaii expertise effectively position the Board to navigate Hawaii’s unique business environment:
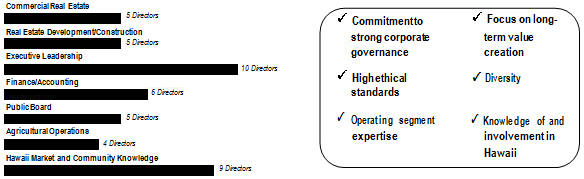
| * | This skills matrix represents the diverse skillsets of our ten directors. All directors are included in multiple categories. |
In selecting nominees, the Board has considered the factors noted above; the current mix of skills and experience represented by our directors; and the qualifications of each nominated director, which includes the factors reflected below.
 | ||

W. Allen Doane Age: |

| 69 Director Since: 2012 |


Director Qualifications
As a member of A&B Predecessor’s senior management team for almost two decades, Mr. Doane, who was Chief Executive Officer and Chairman of the Board of A&B Predecessor until his retirement from those positions in 2009, brings to the Board anin-depth knowledge of all aspects of the Company’s real estate operations, including commercial real estate and real estate development, and its agribusiness operations. Mr. Doane’s experience managing a complex business organization has provided him with financial expertise and he has been designated by the Board of Directors as an Audit Committee Financial Expert. He also has board experience, including his service on various corporate andnon-profit boards, and is knowledgeable about Hawaii and A&B’s operating markets through his involvement in the Hawaii business community and local community organizations.
 | ||

Stanley M. Kuriyama |
Age: |
| 63 Director Since: 2012 |
Director Qualifications
As a member of A&B’s and A&B Predecessor’s senior management team for two decades, Mr. Kuriyama, who is Chairman of the Board and former Chief Executive Officer of A&B, brings to the Board anin-depth knowledge of all aspects of the Company’s real estate operations, including commercial real estate and real estate development, and its agribusiness operations. He is knowledgeable about Hawaii and A&B’s operating markets through his involvement in the Hawaii business community and local community organizations.
| ||

David C. Hulihee |
Age: |
| 68 Director Since: 2013 |
Director Qualifications
As former President and Chief Executive Officer of Grace Pacific and Chairman of the Board and President of Royal Contracting Co., Ltd., both major Hawaii infrastructure and construction companies, Mr. Hulihee brings to the Board construction and development expertise and experience in managing complex business organizations. Mr. Hulihee has board experience, including his service on various corporate andnon-profit boards, and is knowledgeable about Hawaii and A&B’s operating markets through his involvement in the Hawaii business community and local community organizations. Mr. Hulihee also is A&B’s largest individual shareholder, owning or controlling approximately 4.6% of our outstanding shares, and as such his interests are well-aligned with those of shareholders.
CONTINUING DIRECTORS
Continuing Class III Directors Whose Terms Expire at the 2018 Annual Meeting
| ||

Charles G. King |
Age: |
| 71 Director Since: 2012 |
Director Qualifications
With executive positions in Hawaii-based agricultural and real estate entities and as the former head of automotive dealerships located on Kauai and Oahu, Mr. King is an experienced businessman with executive and leadership skills and is the recipient of a number of business leadership awards. He contributes insights about Hawaii and A&B’s operating markets, particularly on Kauai, where A&B has significant business interests. He is knowledgeable about Hawaii and A&B’s operating markets through his involvement in the Hawaii business community and local community organizations.
| |
Douglas M. Pasquale Age: 62 Director Since: 2012 |

Director Qualifications
As Chief Executive Officer of Capstone Enterprises and as former President, Chief Executive Officer and Chairman of the Board of Nationwide Health Properties, Inc. prior to its merger in July 2011 with Ventas, Mr. Pasquale contributes experience in real estate, one of A&B’s main businesses, as well as experience in finance, accounting and managing a complex business organization. This experience has provided Mr. Pasquale with financial expertise, and he has been designated by the Board of Directors as an Audit Committee Financial Expert. He also has board experience, including his service on the boards of other publicly traded companies.
| |

Jenai S. Wall |
Age: |
| 58 Director Since: 2015 |
Director Qualifications
As Chairman and Chief Executive Officer of Foodland, the largest locally-owned grocery retailer in Hawaii, and other entities in its family of companies, Ms. Wall brings to the Board experience in managing complex business organizations and has commercial real estate and retail expertise. She also has board experience, through her service on various corporate andnon-profit boards, and is knowledgeable about Hawaii and A&B’s operating markets through her involvement in the Hawaii business community and local community organizations.
Continuing Class I Directors Whose Terms Expire at the 2019 Annual Meeting
 | Christopher J. Benjamin Age: 53 Director Since: 2016 | |
Director Qualifications
As a member of A&B’s and A&B Predecessor’s senior management team for over a decade, Mr. Benjamin, who is President and Chief Executive Officer of A&B, brings to the Board anin-depth knowledge of all aspects of the Company’s real estate operations, including commercial real estate and real estate development, its agribusiness operations and its financial operations. He is knowledgeable about Hawaii and A&B’s operating markets through his involvement in the Hawaii business community and local community organizations.
 | Robert S. Harrison Age: 56 Director Since: 2012 |
Director Qualifications
As Chairman and Chief Executive Officer of FHB, Hawaii’s largest financial institution, Mr. Harrison brings to the Board experience in managing complex business organizations. He also has banking and financial expertise. Mr. Harrison has board experience through his service on various corporate andnon-profit boards and is knowledgeable about Hawaii and A&B’s operating markets through his involvement in the Hawaii business community and local community organizations.
 | Michele K. Saito Age: 57 Director Since: 2012 |
Director Qualifications
As President of DTRIC Insurance Company and former President of Farmers, two of Hawaii’s largest insurance companies, Ms. Saito brings to the Board experience in managing a complex business organization and financial and accounting expertise. Ms. Saito also has board experience, including her service on various corporate andnon-profit boards, and is knowledgeable about Hawaii and A&B’s operating markets through her involvement in the Hawaii business community and local community organizations.
 | Eric K. Yeaman Age: 49 Director Since: 2012 |
Director Qualifications
As President and Chief Operating Officer of FHB and former Chief Executive Officer of Hawaiian Telecom, the state’s leading integrated communications company, Mr. Yeaman brings to the Board experience in managing complex business organizations. He also has financial and accounting expertise and has been designated by the Board of Directors as an Audit Committee Financial Expert. Mr. Yeaman has board experience, including his service on the boards of other publicly traded companies. He is knowledgeable about Hawaii and A&B’s operating markets through his involvement in the Hawaii business community and local community organizations.
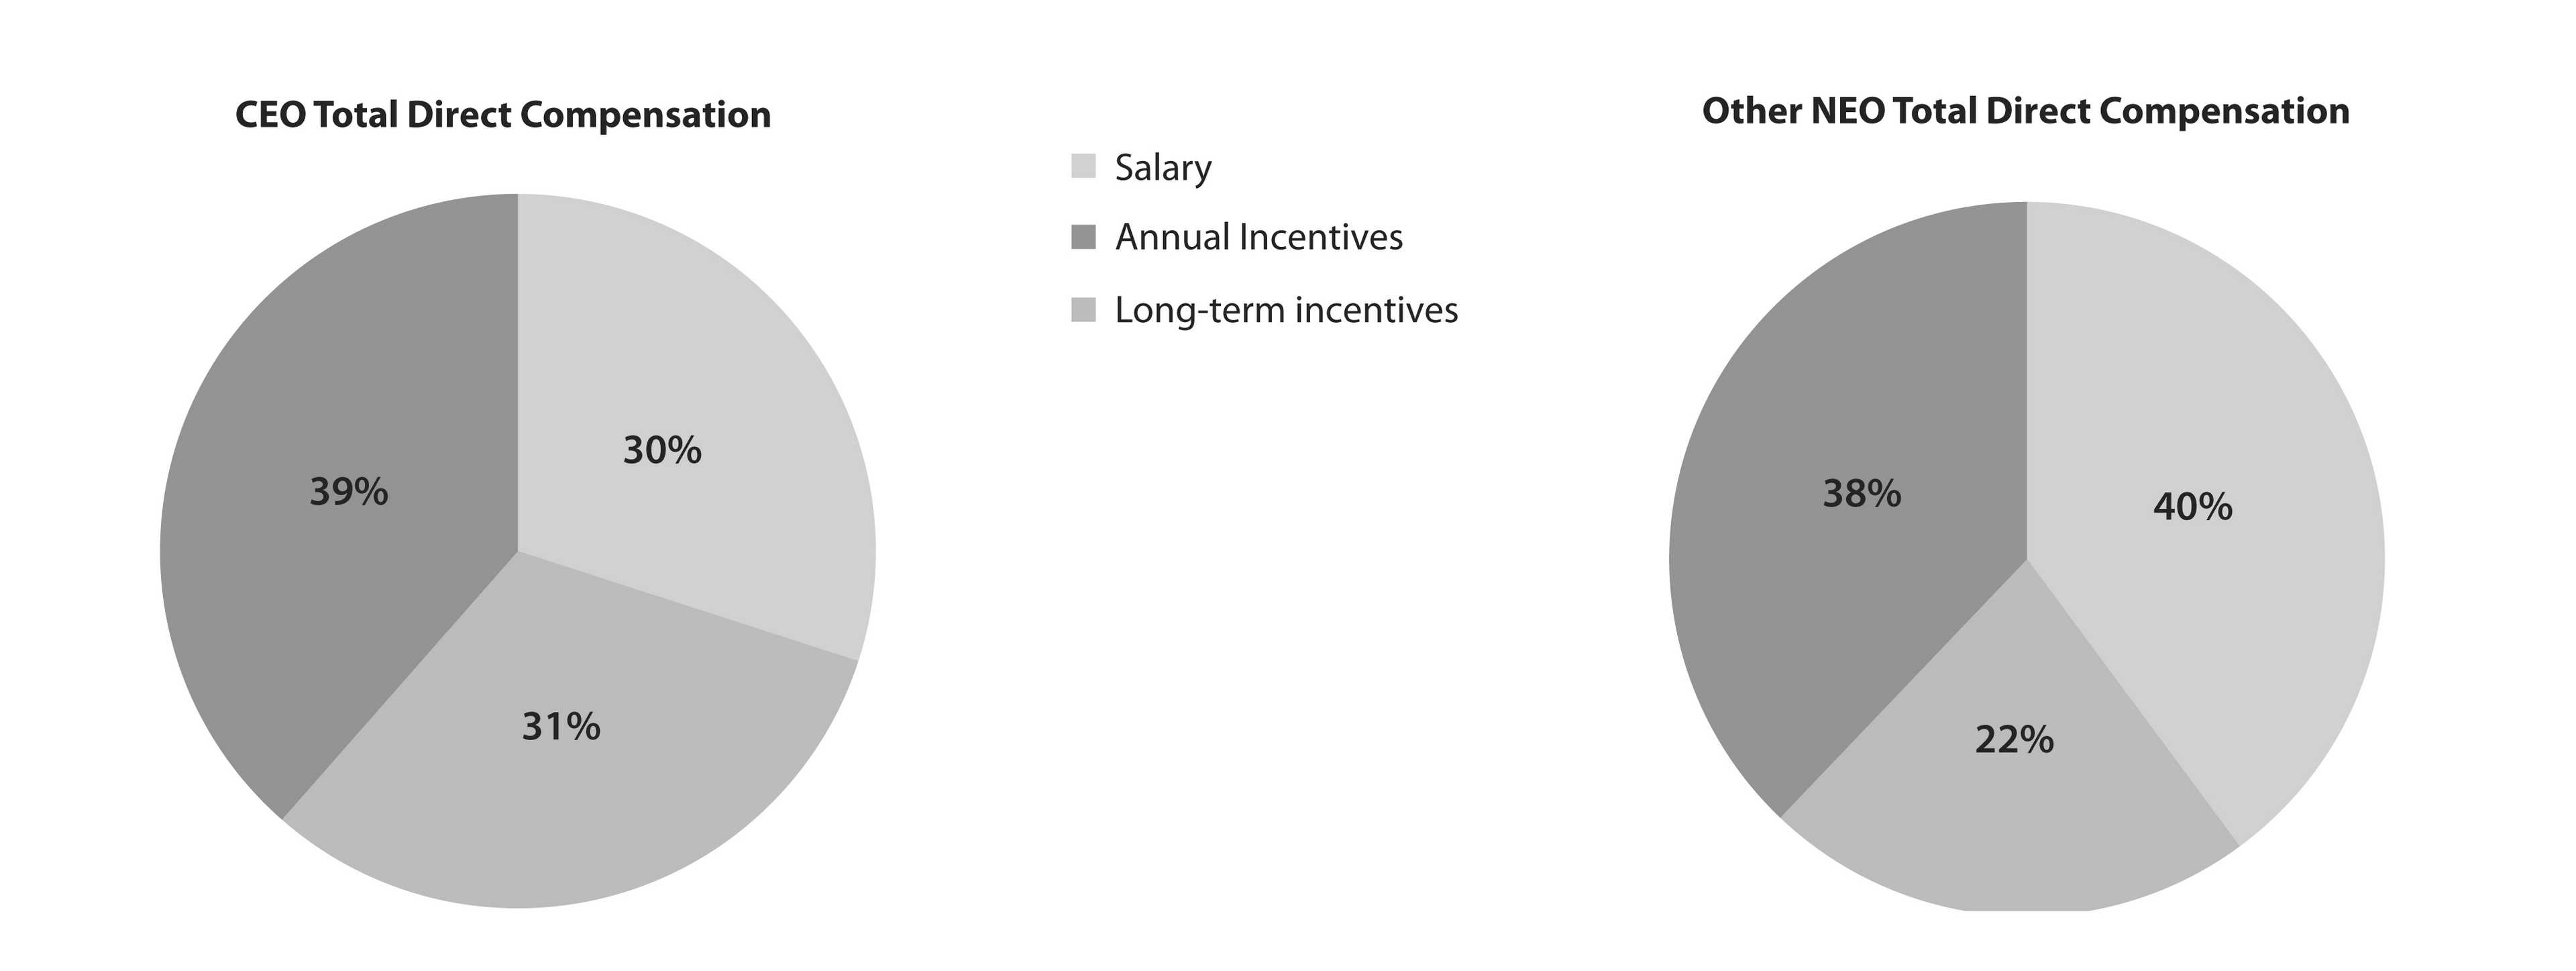
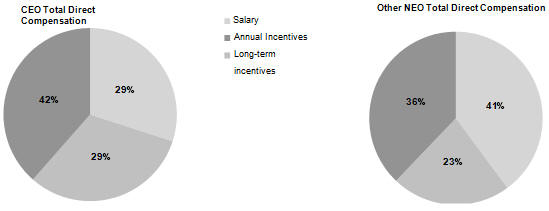
Mr. Kuriyama transitioned from executive Chairman of the Board (“Chairman”) tonon-executive Lead Independent Director Duties Include This risk management process occurs throughout all levels of the organization but is also facilitated through a formal process in which the Company identifies significant risks through regular discussions with all levels of management. Risk management is reflected in the Company’s compliance, auditing and risk management functions, and its Based on its formal review process, the Compensation Committee concluded that there continues to be no material adverse effects due to pay risk. Management and the Compensation Committee concluded that A&B’s employee compensation programs represent an appropriate balance of fixed and variable pay, cash and equity, short-term and long-term compensation, financial andnon-financial performance, and an appropriate level of enterprise-wide risk oversight. Strong Compensation Risk Management Board of Directors and Committees of the Board.The Board of Directors held Name Christopher J. Benjamin W. Allen Doane Robert S. Harrison David C. Hulihee Charles G. King Stanley M. Kuriyama Douglas M. Pasquale Michele K. Saito Jenai S. Wall Eric K. Yeaman Audit Committee The Board has determined that each member is independent under the applicable NYSE listing standards and SEC rules. In addition, the Board has determined that Messrs. Pasquale, Doane and Yeaman are “audit committee financial experts” under SEC rules. The duties and responsibilities of the Audit Committee are set forth in a written charter adopted by the Board of Directors and are summarized in the Audit Committee Report, which appears in this Proxy Statement. The Audit Committee met five times during Compensation Committee The Board has determined that each member is independent under the applicable NYSE listing standards. The Compensation Committee has general responsibility for management and other salaried employee compensation and benefits, including incentive compensation and stock incentive plans, and for making recommendations to the Board on director Nominating and Corporate Governance Committee The Board has determined that each member is independent under the applicable NYSE listing standards. The functions of the Nominating Committee include recommending to the Board individuals qualified to serve as directors; recommending to the Board the size and composition of committees of the Board and monitoring the functioning of the committees; advising on Board composition and procedures; reviewing corporate governance issues; overseeing the annual evaluation of the Board; and ensuring that an evaluation of management is occurring. The Nominating Committee met The Nominating Committee will consider director candidates recommended by shareholders. In considering such candidates, the Nominating Committee will take into consideration the needs of the Board and the qualifications of the candidate. To have a candidate considered by the Nominating Committee, a shareholder must submit a written recommendation that includes the name of the shareholder, evidence of the shareholder’s ownership of A&B stock The shareholder recommendation and information described above must be sent to the Corporate Secretary at 822 Bishop Street, Honolulu, Hawaii, 96813 and must be received not less than 120 days before the anniversary of the date on which A&B’s Proxy Statement was released to shareholders in connection with the previous year’s annual meeting. The Nominating Committee believes that the minimum qualifications for serving as a director are high ethical standards, a commitment to shareholders, a genuine interest in A&B and a willingness and ability to devote adequate time to a director’s duties. The Nominating Committee also may consider other factors it deems to be in the best interests of A&B and its shareholders, such as business experience, financial expertise and knowledge and involvement in Hawaii communities and businesses. While the Nominating Committee does not have a written diversity policy, it considers diversity of knowledge, skills, professional experience, education and expertise, and representation in industries and geographies relevant to the Company as important factors in its evaluation of candidates. Once a potential candidate has been identified by the Nominating Committee, the Nominating Committee reviews information regarding the person to determine whether the person should be considered further. If appropriate, the Nominating Committee may request information from the candidate, review the person’s accomplishments, qualifications and references, and conduct interviews with the candidate. The Nominating Committee’s evaluation process does not vary based on whether or not a candidate is recommended by a shareholder. Corporate Governance Guidelines. Select Corporate Governance Guideline Topics The full text of the A&B Corporate Governance Guidelines is available on the corporate governance page of A&B’s corporate website, www.alexanderbaldwin.com. Compensation of Directors.The Company periodically reviews the compensation of itsnon-employee Directors with the assistance of its executive compensation consultant, Willis Towers Watson (“WTW”). The compensation levels, components, and share-ownership guidelines were last reviewed in July 2016 and deemed to be well aligned with market competitive practices. The following table summarizes the compensation earned by or paid to our directors (other than Mr. 2016 DIRECTOR COMPENSATION Name W. Allen Doane Robert S. Harrison David C. Hulihee Charles G. King Stanley M. Kuriyama Douglas M. Pasquale Michele K. Saito Jenai S. Wall Eric K. Yeaman Our Board of Directors approved the followingnon-employee director compensation schedule of annual fees, which was developed with the assistance of Pay Element Annual Board Retainer Lead Director Retainer (additional) Committee Chair • Audit Retainers (in addition • Compensation to committee member retainer) • Nominating and Corporate Governance • Audit Committee Member • Compensation Retainers (additional) • Nominating and Corporate Governance Annual Equity Award Directors are provided an additional per meeting fee of $750 if the number of board or committee meetings exceeds an annual predefined number, which is currently set at: Under the terms of the Alexander & Baldwin, Inc. 2012 Incentive Compensation Plan (“2012 Plan”), an automatic annual grant of approximately $90,000 in restricted stock units (“RSUs”) is made to each director at each Annual Meeting of Shareholders. A prorated grant is made upon appointment as a director at any time between Annual Meetings. These awards vest in equal increments ofone-third each over three years.Non-employee directors may defer all or a portion of their vested shares until cessation of board service or the fifth anniversary of the award date.Non-employee directors may defer half or all of their annual cash retainer and meeting fees until retirement or until a later date they may select; no directors have deferred any of these fees as of December 31, Under A&B Predecessor’s retirement plan for directors, which was frozen effective December 31, 2004, a director with five or more years of service will receive alump-sum payment upon retirement or attainment of age 65, whichever is later, that is actuarially equivalent to a payment stream for the life of the director consisting of 50 percent of the amount of the annual retainer fee in effect on December 31, 2004, plus 10 percent of that amount for each year of service as a director over five years (up to an additional 50 percent). Only Mr. King has an accrued benefit under the retirement plan for directors. Director Business Travel Accident Coverage. Matching Gift Program. In addition, A&B’s directors are encouraged to attend the Annual Meeting of Shareholders. All of the A&B directors attended the The following table lists the names and addresses of the only shareholders known by A&B on February Name and Address of Beneficial Owner BlackRock, Inc. 40 East 52nd Street New York, NY 10022 The London Company 1801 Bayberry Court, Suite 301 Richmond, VA 23226 The Vanguard Group 100 Vanguard Blvd. Malvin, PA 19355 T. Rowe Price Associates, Inc. 100 E. Pratt Street Baltimore, MD 21202 EJF Capital LLC 2107 Wilson Boulevard, Suite 410 Arlington, VA 22201 Security Ownership of Directors and Executive Officers. Name or Number in Group W. Allen Doane Robert S. Harrison David C. Hulihee Charles G. King Stanley M. Kuriyama Douglas M. Pasquale Michele K. Saito Jenai S. Wall Eric K. Yeaman Christopher J. Benjamin Paul K. Ito Nelson N. S. Chun Meredith J. Ching Lance K. Parker 15 Directors and Executive Officers as a Group Section 16(a) Beneficial Ownership Reporting Compliance. The Audit Committee has established written procedures to address situations when approvals need to be sought between meetings. Whenever possible, proposed related person transactions will be included as an agenda item at the next scheduled Audit Committee meeting for review and approval. However, if it appears that a proposed related person transaction will occur prior to the next scheduled Audit Committee meeting, approval will be sought from Audit Committee members between meetings. Approval by a majority of the Committee members will be sufficient to approve the related person transaction. If a related person transaction is approved in this manner, the action will be reported at the next Audit Committee meeting. A&B’s business strategy is Hawaii-focused and, accordingly, a number of our directors are Hawaii-based executives who provide extensive local knowledge and insight. Hawaii’s business community is relatively small and isolated. Given A&B’s position as Hawaii’s fourth largest private landowner, the Related Person Relationships with First Hawaiian FHB (i) has a In addition, after the acquisition of Grace Pacific on October 1, 2013, FHB has the following loans or lines of credit with the Company or its subsidiaries/affiliates: (i) Jenai S. Wall, a director of A&B, is Chairman and Chief Executive Officer of Foodland. Foodland or its subsidiaries are commercial tenants in 2017 and 2031, with aggregate gross rents in David C. Hulihee – Consulting Agreement: After Mr. Hulihee’s retirement as Chief Executive Officer of Grace Pacific as of December 31, 2015, Grace Pacific entered into aone-year consulting agreement with Mr. Hulihee in which he The CD&A addresses A&B’s compensation practices for Executive Summary In Approach to Compensation Governance. Promote Good Pay Practices Avoid Poor Pay Practices • • • • • • • • • • Use of tally sheets and wealth assessments •No employment contracts • • • • • No taxgross-ups • • • Performance Accomplishments in Segment Realignment During the fourth quarter of 2016, the Company completed an internal reorganization of the operations and reporting structure in order to facilitate operational efficiencies and enhance the execution in the Company’s businesses. Prior to October 1, 2016, the Company operated under four reportable segments: Commercial Real Estate, Commercial Real Estate Segment In 2016, A&B continued to concentrate on its Hawaii-focused commercial real estate strategy. In January 2016, the Company closed on a 141,000 square foot retail center, Manoa Marketplace, which is anchored by Land Operations Segment With the shutdown of the Company’s sugar operations, the Company has combined its diversified agricultural activities with its development for sale activities for financial reporting purposes. The Land Operations segment is focused on managing activities conducted on the Company’s landholdings (historical and acquired), including diversified agriculture, renewable energy and development for sale. Significant accomplishments in 2016 included: Materials & Construction Grace Pacific continued to generate solid cash flows in 2016, although its results were significantly impacted by unusually wet weather (233 crew days were rained out in 2016 compared to an annual average of 134 days over the past three years) and a slower-than-anticipated pace of jobs released for commencement of construction. The lower performance at Grace Pacific was partially offset by strong performance at Grace’s asphalt business, which benefited from lower oil prices. Other Pay for Performance. Compensation Overview The Company’s executive compensation programs are administered by its Compensation Committee. After conducting a search for an independent consultant in 2012, the Compensation Committee retained Compensation Philosophy and Objectives. Element of Pay Composition Metrics Rationale •Provides a fixed rate of pay based upon an executive’s responsibilities •Rewards achievement of annual Company, business unit and individual performance •Reinforces pay for performance principles Relative and Russell 2000) •Aligns the executives’ long-term interests with those of A&B’s shareholders, motivates long-term performance and provides retention benefits • • Aids in attracting and retaining employees • Aligns the executives’ long-term interests with those of A&B’s shareholders, motivates long-term performance and provides retention benefits • Aids in attracting and retaining employees •Aids in attracting and retaining employees •Assists employees with retirement income savings and attracts and retains employees •Retains talent during transitions due to a Change in Control or other covered events Pay Percentage of Target Total Direct Compensation Provided by Each Pay Element for 2016 As 2016 was Mr. Benjamin’s first year as CEO, the Committee set his long-term incentive award well below the 50th percentile of market. As a result, his long-term incentive mix is a lower percentage of his Total Direct Compensation and his salary percentage is inflated. As Mr. Benjamin’s tenure increases, his long-term incentive awards are expected to move toward the Company’s compensation philosophy of targeting the 50th percentile. This would result in a pay mix that is more aligned with market practices. Assessment of Total Compensation. • • Positioning in relation to the pay philosophy • Say-on-Pay vote results • Projected salary increases in the general industry • Competitive survey data • Value of the total pay package • Economic environment • Alignment to pay for performance • Job responsibilities and experience • Reasonableness and balance of pay risk • Positioning within the executive’s salary range • Internal pay equity • Tally sheets covering the past 5 years • • Accrued benefits balances • Size of recent awards Internal Pay 2016 Ratio of Target and Actual CEO Pay to Other NEOs A&B Target A&B Actual* Benchmark Data (target) Pay Elements The Company provides the following pay elements to its executive officers in varying combinations to accomplish its compensation objectives. Salary:Salary is intended to provide a competitive fixed rate of pay based upon an executive’s responsibilities. Because the Company believes that salary is less impactful than performance-based compensation in achieving the overall objectives of the Company’s executive compensation program, at target, between 30% to 40% of an NEO’s total compensation is paid as salary. Generally, the Board of Directors determines the CEO’s annual salary change on the basis of the factors listed previously in the The CEO recommends annual salary changes for the other NEOs. Salary adjustments for NEOs are generally considered by the Compensation Committee in February of each year for implementation on April 1. Any base salary increases for NEOs in Salary Information for NEO Mr. Benjamin Mr. Ito Mr. Chun Ms. Ching Mr. Parker Annual Incentives: The Company believes that the annual incentive structure drives the following objectives: Company and Business Unit For determination of award pool funding for Corporate Goal ($ in millions) Commercial Real Estate Same-Store Adjusted NOI4 Total Commercial Real Estate Adjusted NOI4 Real Estate Development & Sales Gross Margin4 EBITDA4 – Materials & Construction Construction Backlog – Materials & Construction Consolidated AdjustedPre-tax Income4 Value Creation – Blended The incentive compensation for The levels of achievement for financial and operating goals and value creation are rated on a scale from 0 to 3, as follows: 0 for below threshold performance, 1.0 for threshold performance, 2.0 for target performance and to 3.0 for maximum performance, with proration in between threshold, target and maximum. Based on The term “Value Creation” reflects performance and accomplishments of the Company that Individual Performance. Individual performance of the other NEOs is reviewed and assessed by the CEO. The CEO did not apply any individual modifiers. Actual awards earned in total by the NEOs versus target were lower than the overall targeted goal payouts and were as follows: NEO Mr. Benjamin Mr. Ito Mr. Chun Ms. Ching Mr. Parker Equity-Based Equity grants are generally considered and granted annually in January by the Compensation Committee. Based on current market data provided by In The actual performance level attained for the Performance Range Threshold Target Maximum LTI and Total Direct Compensation Positioning for NEO Mr. Benjamin Mr. Ito Mr. Chun Ms. Ching Mr. Parker Retirement A&B Retirement Plan for Salaried Employees A&B Individual Deferred Compensation and Profit Sharing A&B Excess Benefits No Severance Plan and Change in Control Agreements: Retiree Health and Medical Plan: The Role of Survey Data The Company uses published survey data as a reference, but does not benchmark against specific companies within such surveys. The Company operates in a number of different industries and there are no companies that are considered directly comparable in business mix, size and geographic relevance. Accordingly, the Company does not use data that are specific to any individual segment of the Company’s business but instead, based on the recommendation of The surveys used by The Role of the Compensation Consultant After conducting a search, the Compensation Committee selected and has since directly retained The executive compensation consultant reports directly to the Committee and takes instructions from the Committee. The Committee Chairpre-approves all In selecting WTW takes the following safeguards to ensure that its services and advice are objective: The Compensation Committee has reviewed The Role of Management Management assists the Compensation Committee in its role of determining executive compensation in a number of ways, including: Tax and Accounting Considerations In evaluating the Company’s executive compensation structure, the Compensation Committee considers tax and accounting treatment, balancing the effects on the individual and the Company. Section 162(m) of the Internal Revenue Code limits the tax deductibility of certain executive compensation in excess of $1,000,000 for any fiscal year, except for certain “performance-based compensation.” However, in establishing the cash and equity incentive compensation programs for the executive officers, the Compensation Committee believes that the potential deductibility of the compensation payable under those programs should be only one of a number of relevant factors taken into consideration, and not the sole or primary factor. The Compensation Committee believes that cash and equity incentive compensation must be maintained at the requisite level to attract and retain the executive officers essential to the Company’s financial success, even if all or part of that compensation may not be deductible by reason of the Section 162(m) limitation. Stock Ownership Guidelines To enhance shareholder alignment and ensure commitment to value-enhancing longer-term decision-making, the Company has established stock ownership guidelines. Executives are required to own a value of stock equal to the salary multiple below within a five year-period from commencement of employment or within a five-year period after a change in salary based on promotion: Position CEO Other NEOs All NEOs have met or are on track to meet the ownership guidelines. Equity Granting Policy Equity awards are expected to be granted for current employees at the January Compensation Committee meeting each year. Equity grants for new hires or promoted employees are approved at regularly scheduled Compensation Committee meetings. The timing of these grants is made without regard to anticipated earnings or other major announcements by the Company. Policy Regarding Speculative Transactions and Hedging The Company has adopted a formal policy prohibiting directors, officers and employees from (i) entering into speculative transactions, such as trading in options, warrants, puts and calls or similar instruments, involving A&B stock, or (ii) hedging or monetization transactions, such aszero-cost collars and forward sale contracts, involving A&B stock. Policy Regarding Recoupment of Certain Compensation The Company has adopted a formal “clawback” policy for senior management, including all NEOs. Pursuant to the policy, the Company will seek to recoup certain incentive compensation, including cash and equity bonuses based upon the achievement of financial performance metrics, from executives in the event that the Company is required to restate its financial statements due to a material noncompliance with any financial reporting requirement. The Compensation Committee has reviewed and discussed the CD&A section of this Proxy Statement with management and, based on these discussions and review, it has recommended to the Board of Directors that the CD&A disclosure be included in this Proxy Statement. The foregoing report is submitted by Mr. King (Chairman), Ms. Saito and Ms. Wall. During 2016 SUMMARY COMPENSATION TABLE Name and Principal Position (a) Christopher J. Benjamin President and Chief Executive Officer of A&B 2015 2014 462,438 448,969 74,067 171,657 460,422 445,256 N/A N/A 146,115 158,343 0 212,875 (6) 7,950 21,314 1,150,992 1,458,414 Paul K. Ito Senior Vice President, Chief Financial Officer, and Treasurer of A&B 2015 2014 358,054 338,756 57,350 102,399 409,291 395,827 N/A N/A 113,132 122,601 0 101,802 (7) 7,161 17,997 944,988 1,079,382 Nelson N. S. Chun Senior Vice President and Chief Legal Officer of A&B 2015 2014 320,001 310,680 42,713 78,690 255,817 247,383 N/A N/A 84,257 91,310 0 133,234 (8) 7,950 17,151 710,738 878,448 Meredith J. Ching Senior Vice President, Government & Community Relations of A&B 2015 2014 254,156 241,062 36,017 83,005 N/A N/A 71,049 76,995 0 349,616 (9) 7,625 14,107 624,664 1,012,168 Lance K. Parker President, ABP 2016 GRANTS OF PLAN-BASED AWARDS All Other Stock Awards: Number of All Other Option Awards: Number of Grant Date Fair Value Name Christopher J. Benjamin Paul K. Ito Nelson N. S. Chun Meredith J. Ching Lance K. Parker The PIIP is based on Outstanding Equity Awards at Fiscal 2016 OUTSTANDING EQUITY AWARDS AT FISCALYEAR-END Name Christopher J. Benjamin Paul K. Ito Nelson N.S. Chun Meredith J. Ching Lance K. Parker OPTION EXERCISES AND STOCK VESTED FOR (a) Christopher J. Benjamin Paul K. Ito Nelson N. S. Chun Meredith J. Ching Lance K. Parker The value realized in column (e) was calculated based on the market value of A&B common stock on the vesting date. No amounts realized upon exercise of options or vesting of stock have been deferred. PENSION BENEFITS FOR Name Plan Name Christopher J. Benjamin A&B Retirement Plan for Salaried Employees A&B Excess Benefits Plan Paul K. Ito A&B Retirement Plan for Salaried Employees A&B Excess Benefits Plan Nelson N. S. Chun A&B Retirement Plan for Salaried Employees A&B Excess Benefits Plan Meredith J. Ching A&B Retirement Plan for Salaried Employees A&B Excess Benefits Plan Lance K. Parker A&B Retirement Plan for Salaried Employees A&B Excess Benefits Plan Actuarial assumptions used to determine the present values of the pension benefits include: Discount rates for qualified andnon-qualified retirement plans of The Excess Benefits Plan benefits are paid as a lump sum equal to the present value of the traditional defined benefit assumed to be paid on a life annuity basis plus the cash balance account. The present value was determined based on interest rates (with 39% marginal tax rate adjustment) and mortality used in our financial disclosures, i.e., A&B Retirement Plan for Salaried Employees The A&B Retirement Plan for Salaried Employees (the “Qualified Retirement Plan”) provides pension benefits to the Company’s salaried employees who are not subject to collective bargaining agreements. In 2007, A&B Predecessor closed participation in its traditional defined pension plan for newnon-bargaining unit employees hired after January 1, 2008. The traditional defined benefit formula was based on participants’ service and average monthly Effective January 1, 2012, a cash balance formula provides a retirement account equal to 5 percent of an employee’s eligible cash compensation, for each year worked, while covered by the cash balance formula, plus interest. The vesting period was reduced from five years to three years for an employee with a cash balance account. At retirement or other separation from service, the employee may elect to receive the vested cash balance portion of the Qualified Retirement Plan benefits as a lump sum or an actuarially equivalent annuity. A&B Excess Benefits Non-Qualified Deferred Compensation.The following table contains information concerningnon-qualified deferred compensation for the NEOs. 2016NON-QUALIFIED Name Christopher J. Benjamin Paul K. Ito Nelson N. S. Chun Meredith J. Ching Lance K. Parker Change in Control In the event that any amount payable to the executive is deemed under the Internal Revenue Code to be made in connection with a change in control of the Company, and such payments would result in the excise tax imposed on “excess parachute payments” under the Internal Revenue Code, the Change in Control Agreements provide that the executive’s payments will be reduced to an amount that would not result in the imposition of the excise tax, to the extent that such reduction would result in a greaterafter-tax benefit to the executive. No taxgross-up payments are provided by the Change in Control Agreements. If there is a potential change in control of the Company, the executive agrees to remain in the employ of the Company until the earliest of (1) a date six months after the occurrence of the potential change in control, (2) the termination of the executive’s employment by reason of disability or retirement, or (3) the occurrence of a change in control of the Company. Executive Severance Plan: Voluntary Other benefits, as described in the CD&A section of this Proxy Statement, may include accrued, vested benefits under the Qualified Retirement Plan and the Excess Benefits Plan. The following tables show the potential value to each executive under various termination-related scenarios, assuming that the termination of employment or other circumstances resulting in payment occurred on December 31, Executive Termination Scenarios Components Cash Severance Retirement Benefits(4) Health & Welfare Benefits Outplacement Counseling Long-Term Incentives(7) Total(Lump-sum) Total (Annuity) Components Cash Severance Retirement Benefits(4) Health & Welfare Benefits Outplacement Counseling Long-Term Incentives(7) Total(Lump-sum) Total (Annuity) Components Cash Severance(8) Retirement Benefits(4) Health & Welfare Benefits Outplacement Counseling Long-Term Incentives(7) Total(Lump-sum) Total (Annuity) Components Cash Severance Retirement Benefits(4) Health & Welfare Benefits Outplacement Counseling Long-Term Incentives(7) Total(Lump-sum) Total (Annuity) Components Cash Severance Retirement Benefits(4) Health & Welfare Benefits Outplacement Counseling Long-Term Incentives(7) Total(Lump-sum) Total (Annuity) All amounts shown arelump-sum payments, unless otherwise noted. Assumptions used in the tables above are set forth in the Pension Benefits section. The Excess Benefits Plan benefits are paid, upon termination, as a lump sum equal to the present value of the traditional defined benefit assumed to be paid on a life annuity basis plus the cash balance account. The lump sum conversion was based on interest rates (with 39% marginal tax rate adjustment) and mortality used in our financial disclosures and included in the Pension Benefits section. Statements in this section that are not historical facts are “forward-looking statements” that involve a number of risks and uncertainties that could cause actual results to differ materially from those contemplated by the relevant The Company calculates NOI as Commercial Real Estate Reconciliation of Commercial Real Estate segment operating profit Adjustments: Depreciation and amortization Straight-line lease adjustments General and administrative expenses and other Commercial Real Estate segment NOI During the fourth quarter of 2016, the Company completed an internal reorganization of its operations and reporting structure in order to facilitate operational efficiencies and enhance the execution in the Company’s businesses. As a result, the Company’s reportable segments have been realigned to reflect the revised operational structure and internal management reporting, pursuant to which the Company’s former Real Estate Development and Sales and Agribusiness segments have been combined into the Land Operations reportable segment. Additionally, the Company realigned agricultural ground leases that were previously included in the Commercial Real Estate segment to the Land Operations segment, and certain industrial ground leases that were previously included in the former Agribusiness segment to the Commercial Real Estate segment. A reconciliation of Commercial Real Estate NOI to Adjusted NOI, which reflects the measure used under the prior segment structure, and Same-Store Adjusted NOI is as follows: Commercial Real Estate segment NOI Adjustments: Agricultural leases Industrial leases Total Commercial Real Estate segment Adjusted NOI Acquisitions / Dispositions and other adjustments Commercial Real Estate Same-Store Adjusted NOI The Company presents thenon-GAAP measure of EBITDA for the Materials & Construction segment, which contain the results of Grace Pacific. The Company uses thisnon-GAAP financial measure when evaluating operating performance for the Materials & Construction segment because management believes that EBITDA provides insight into the segment’s core operating results, future cash flow generation, and the underlying business trends affecting performance on a consistent and comparable basis from period to period. The Company provides this information as an additional means of evaluating the segment’s ongoing core operations. Thenon-GAAP financial information presented herein should be considered supplemental to, and not as a substitute for, or superior to, financial measures calculated in accordance with GAAP. The Company believes that Materials & Construction operating profit is the most directly comparable GAAP measurement to the Reconciliation of Materials & Construction Operating Profit to EBITDA Materials & Construction Operating Profit Depreciation & amortization expense Income attributable tonon-controlling interest EBITDA Consolidated AdjustedPre-tax Income was an operating performance measure for the Company for the year ended December 31, 2016, as management believes that the measure provided insight into the operating results of the Company’s core businesses and the underlying business trends affecting performance on a consistent and comparable basis from period to period. Thenon-GAAP financial information presented herein should be considered supplemental to, and not as a substitute for, or superior to, financial measures calculated in accordance with GAAP. The Company believes that Income From Continuing Operations Before Income Taxes is the most directly comparable GAAP measurement to Consolidated AdjustedPre-tax Income. A reconciliation of Income From Continuing Operations Before Taxes to Consolidated AdjustedPre-tax Income follows: Reconciliation of Net Loss to Consolidated AdjustedPre-tax Income Income From Continuing Operations Before Taxes Adjustments: Operating profit from sugar operations, excluding cessation Reduction in solar investments REIT evaluation costs Other Consolidated AdjustedPre-tax Income Shareholders are being asked to vote to approve, on anon-binding, advisory basis, the compensation of our NEOs. A&B’s compensation philosophy is to drive the Company’s The following resolution is being submitted for a shareholder advisory vote at the Annual Meeting: “RESOLVED, that the Company’s shareholders approve, on an advisory basis, the compensation of the named executive officers, as disclosed in the Company’s Proxy Statement for the Although the advisory vote isnon-binding, the Compensation Committee and the Board will review the results of the vote and consider them in future determinations concerning our executive compensation program. As announced previously, we will provide shareholders the opportunity to cast an advisory vote on executive compensation on an annual basis. The Board of Directors recommends that shareholders vote FOR the approval of the resolution relating to executive compensation. The Audit Committee provides assistance to the Board of Directors in fulfilling its obligations with respect to matters involving the accounting, auditing, financial reporting, internal control and legal compliance functions of A&B, including the review and approval of all related person transactions required to be disclosed in this Proxy Statement. Among other things, the Audit Committee reviews and discusses with management and Deloitte & Touche LLP, The Audit Committee has received the written communication regarding independence from Deloitte & Touche LLP required under the rules of the Public Company Accounting Oversight Board, and has discussed with Deloitte & Touche LLP its independence from A&B. The Audit Committee has determined that the provision ofnon-audit services rendered by Deloitte & Touche LLP to A&B is compatible with maintaining the independence of Deloitte & Touche LLP from A&B in the conduct of its auditing function. Based on the review and discussions referred to above, the Audit Committee recommended to the Board of Directors that A&B’s audited consolidated financial statements be included in A&B’s Annual Report on Form10-K for the fiscal year ended December 31, The foregoing report is submitted by Mr. Pasquale (Chairman), Mr. Doane and Mr. Yeaman. The Audit Committee of the Board of Directors has appointed Deloitte & Touche LLP as the independent registered public accounting firm of A&B for the ensuing year, and the Audit Committee recommends that shareholders vote in favor of ratifying such appointment. Although ratification of this appointment is not required by law, the Board believes that it is desirable as a matter of corporate governance. If shareholders do not ratify the appointment of Deloitte & Touche LLP, it will be considered as a recommendation to the Board and the Audit Committee to consider the retention of a different firm. Representatives of Deloitte & Touche LLP are expected to be present at the Annual Meeting, where they will have the opportunity to make a statement if they desire to do so and will be available to respond to appropriate questions from shareholders. In compliance with the Sarbanes Oxley Act of 2002 and applicable SEC rules, the Audit Committee has adopted policies and procedures for Audit Committee approval of audit andnon-audit services. Under such policies and procedures, the Audit Committeepre-approves or has delegated to the Chairman of the Audit Committee authority topre-approve all audit andnon-prohibited,non-audit services performed by the independent registered public accounting firm in order to assure that such services do not impair the auditor’s independence. Any additional proposed services or costs exceedingpre-approved cost levels require additionalpre-approval as described above. The Audit Committee may delegatepre-approval authority to one or more of its members for services not to exceed a specific dollar amount per engagement. Requests forpre-approval include a description of the services to be performed, the fees to be charged and the expected dates that the services will be performed. All services provided by Deloitte & Touche LLP during For the years ended December 31, Audit Fees. Audit-Related Fees. Tax Fees. All Other Fees. SHAREHOLDERS WITH THE SAME ADDRESS Individual shareholders sharing an address with one or more other shareholders may elect to “household” the mailing of the Notice of Internet Availability of Proxy Materials or our annual report and proxy statement. This means that only one Notice of Internet Availability of Proxy Materials or our annual report and proxy statement will be sent to that address unless one or more shareholders at that address specifically elect to receive separate mailings. Shareholders who participate in householding will continue to receive separate proxy cards. We will promptly send a separate Notice of Internet Availability of Proxy Materials or our annual report and proxy statement to a shareholder at a shared address on request. Shareholders with a shared address may also request us to send separate Notices of Internet Availability of Proxy Materials or our annual reports and proxy statements in the future, or to send a single copy in the future if we are currently sending multiple copies to the same address. Requests related to householding should be mailed to Alexander & Baldwin, Inc., P.O. Box 3440, Honolulu, HI OTHER BUSINESS The Board of Directors of A&B knows of no other business to be presented for shareholder action at the Annual Meeting. However, should matters other than those included in this Proxy Statement properly come before the Annual Meeting, the proxy holders named in the accompanying proxy will use their best judgment in voting upon them. Proposals of shareholders intended to be presented pursuant to Rule14a-8 under the Exchange Act at the In order for proposals of shareholders made outside of Rule14a-8 under the Exchange Act to be considered “timely” within the meaning of Rule14a-4(c) under the Exchange Act, such proposals must be received at the headquarters of A&B not later than December The Company’s Bylaws provide that no person (other than a person nominated by the Board) will be eligible to be elected a director at an annual meeting of shareholders unless the Corporate Secretary has received, not less than 120 days nor more than 150 days before the anniversary date of the prior annual meeting, a written shareholder’s notice in proper form that the person’s name be placed in nomination. If the annual meeting is not called for a date which is within 25 days of the anniversary date of the prior annual meeting, a shareholder’s notice must be given not later than 10 days after the date on which notice of the annual meeting was mailed or public disclosure of the date of the annual meeting was made, whichever occurs first. To be in proper written form, a shareholder’s notice must include information about each nominee and the shareholder making the nomination. The notice also must be accompanied by a written consent of each proposed nominee to being named as a nominee and to serve as a director if elected. • Go towww.envisionreport.com/ALEX • Or scan the QR code with your smartphone • Follow the steps outlined on the secure website • Call toll free1-800-652-VOTE (8683) within the USA, US territories & Canada on a touch tone telephone • Follow the instructions provided by the recorded message q IF YOU HAVE NOT VOTED VIA THE INTERNETOR TELEPHONE, FOLD ALONG THE PERFORATION, DETACH AND RETURN THE BOTTOM PORTION IN THE ENCLOSED ENVELOPE.q + Mark here to vote FOR all nominees Mark here to WITHHOLD vote from all nominees NOTE:Such other business as may properly come before the meeting or any adjournments thereof. THIS PROXY WILL BE VOTED IN THE MANNER DIRECTED HEREIN BY THE UNDERSIGNED SHAREHOLDER. IF NO DIRECTION IS GIVEN, THIS PROXY WILL BE VOTED FOR PROPOSALS 1, 2, AND 3 AND IN THE DISCRETION OF THE PROXIES ON SUCH OTHER MATTERS AS PROPERLY MAY COME BEFORE THE MEETING OR ANY ADJOURNMENTS OR POSTPONEMENTS THEREOF. NOTE: Please sign as name appears hereon. Joint owners should each sign. When signing as attorney, executor, administrator, trustee or guardian, please give full title as such. Date (mm/dd/yyyy) — Please print date below. / / + Important notice regarding the Internet availability of proxy materials for the Annual Meeting of shareholders.The Proxy Statement and the 2016 Annual Report to Stockholders are available at:www.envisionreports.com/ALEX q IF YOU HAVE NOT VOTED VIA THE INTERNETOR TELEPHONE, FOLD ALONG THE PERFORATION, DETACH AND RETURN THE BOTTOM PORTION IN THE ENCLOSED ENVELOPE.q Proxy — ALEXANDER & BALDWIN, INC. 822 Bishop Street, Honolulu, Hawaii 96813 PROXY FOR ANNUAL MEETING OF SHAREHOLDERS, APRIL 25, 2017 SOLICITED ON BEHALF OF THE BOARD OF DIRECTORS The undersigned hereby appoints C.G. King, S.M. Kuriyama and D.M. Pasquale, and each of them, proxies with full power of substitution, to vote the shares of stock of Alexander & Baldwin, Inc., which the undersigned is entitled to vote at the Annual Meeting of Shareholders of the THIS PROXY WILL BE VOTED IN THE MANNER DIRECTED HEREIN BY THE UNDERSIGNED SHAREHOLDER. IF NO DIRECTION IS GIVEN, THIS PROXY WILL BE VOTED FOR PROPOSALS 1, 2, AND 3 AND IN THE DISCRETION OF THE PROXIES ON SUCH OTHER MATTERS AS PROPERLY MAY COME BEFORE THE MEETING OR ANY ADJOURNMENTS OR POSTPONEMENTS THEREOF. PLEASE SIGN, DATE AND RETURN THIS PROXY PROMPTLY IN THE ENCLOSED ENVELOPE. (continued and to be marked, dated and signed, on other side)CERTAIN INFORMATION CONCERNING THE BOARD OF DIRECTORSThe Board has reviewed each of its current directors and nominees and has determined that all such persons, with the exception of Mr. Benjamin, Mr. Kuriyama (who retired as an employee of A&B on December 31, 2016) and Mr. Hulihee (who retired as an employee of A&B on December 31, 2015) who are or were employees of A&B or its subsidiaries within the past three years, are independent under New York Stock Exchange (“NYSE”) rules. In making its independence determinations, the Board considered the transactions, relationships or arrangements in “Certain Information Regarding Directors and Executive Officers – Certain Relationships and Transactions” below, as well as the following: Mr. Doane – his status as a former executive officer of A&B Predecessor, banking relationships with FHB, an entity of which Mr. Doane is a director, and a reservation tothe purchase of a condominium unit in an A&B project at full market price; Mr. Harrison – A&B’s banking relationships with FHB, an entity of which Mr. Harrison is Chairman of the Board and Chief Executive Officer; Mr. Yeaman – A&B’s banking relationships with FHB, an entity of which Mr. Yeaman is President and Chief Operating Officer; Mr. Pasquale – partial reimbursement of professional fees and related costs incurred in determining the applicability of a local excise tax to anon-resident director; and Ms. Wall – A&B’s banking relationships with FHB, an entity of which Ms. Wall is a director.The Board recognizes that one of its key responsibilities is to evaluate and determine its optimal leadership structure so as to provide independent oversight of management. It understands that there is no single approach to providing Board leadership and that the right Board leadership structure may vary as circumstances warrant.8 Chairman, effective January 1, 2017. The Board currently has a separatenon-executive Chairman, of the Board (in an executive capacity), a Chief Executive Officer (“CEO”) and a Lead Independent Director (Charles G. King). At this time, the Board believes that a separate Chairman is beneficial in providing oversight and leadership in handling board responsibilities. This also allows our CEO to focus on Company strategy and business operations. A Lead Independent Director allows the Board to function independently from management and is capable of objective judgment regarding management’s performance. The Board has determined that its leadership structure is appropriate for A&B at this time.Consulting with the Chairman of the Board on agendas and meeting schedulesFacilitating the process for the Board’s self-evaluationPresiding at Board meetings in the absence of the ChairmanPresiding at executive sessions ofnon-management DirectorsLead Independent Director Duties Include•Consulting with the Chairman of the Board on agendas and meeting schedules•Facilitating the process for the Board’s self-evaluation•Presiding at Board meetings in the absence of the Chairman•Presiding at executive sessions of non-management Directors•Facilitating communication between the Independent Directors and the Chairman and Chief Executive OfficerThe Board has oversight of the risk management process, which it administers in part through the Audit Committee. One of the Audit Committee’s responsibilities involves discussing policies regarding risk assessment and risk management. Risk oversight plays a role in all major Board decisions and the evaluation of risk is a key part of the decision-making process. For example, the identification of risks and the development of sensitivity analyses are key requirements for capital requests that are presented to, and evaluated by, the Board.risk-basedrisk- based approach to strategic and operating decision-making. Management reviews its risk management activities with the Audit Committee and the full Board of Directors on a regular basis. In addition, risk management perspectives from each of A&B’s business segments are included in the Company’s operating and strategic plans. The Board believes that its current leadership structure is conducive to the risk oversight process.The Compensation Committee has a formal review process to consider and discuss the compensation policies, plans and structure for all of the Company’s employees, including the Company’s executive group, to ascertain whether any of the compensation programs and practices create excessive risks or motivate risky behaviors that are reasonably likely to have a material adverse effect on the Company. Management has worked with the Compensation Committee to review all Company incentive plans and related policies and practices, and the overall structure and positioning of total pay, pay mix, the risk management process and related internal controls.Robust stock ownership guidelinesMulti-year vesting periods of equity awards9Capped incentive paymentsUse of multiple performance metrics• Strong Compensation Risk Management•Robust stock ownership guidelines•Multi-year vesting periods of equity awards•Capped incentive payments•Use of multiple performance metrics•Pay philosophy for all elements of pay targeted at the 50thpercentile•Reasonable payout tied to performance (e.g., incentive pool funding of 50% at threshold, 100% at target, 200% at maximum, with linear interpolation between each goal); individual awards can be further modified, ranging from 0% (no award) to 150%, so long as the aggregate incentive pool is not exceeded (i.e., zero sum)•50% of equity award is performance-based using total shareholder return metrics over three years•Review of goal-setting by the Compensation Committee to ensure that goals are reasonable•Mix of pay that is consistent with competitive practices for organizations similar in size•Insider trading and hedging prohibitions•A compensation clawback policy•Oversight by a Compensation Committee composed of independent directorsReasonable payout tied to performance (e.g., incentive pool funding of 50% at threshold, 100% at target, 200% at maximum, with linear interpolation between each goal); individual awards can be further modified, ranging from 0% (no award) to 150%, so long as the aggregate incentive pool is not exceeded (i.e., zero sum)
50% of NEOs’ equity awards granted are performance-based, using total shareholder return over three years as a performance metricReview of goal-setting by the Compensation Committee to ensure that goals are reasonableMix of pay that is consistent with competitive practices for organizations similar in size and complexityInsider trading and hedging prohibitionsA compensation clawback policyOversight by a Compensation Committee composed of independent directorseightten meetings during 2015.2016. In conjunction with five of these meetings, the non-managementindependent directors of A&B met in formally-scheduled executive sessions led by the Lead Independent Director.Director (Charles G. King). In 2015,2016, all directors were present at more than 75%, and sixeight directors were present at 100%, of the meetings of the A&B Board of Directors and Committees of the Board on which they serve. The Board of Directors has an Audit Committee, a Compensation Committee and a Nominating and Corporate Governance Committee, each of which is governed by a charter, which is available on the corporate governance page of A&B’s website, www.alexanderbaldwin.com.Audit Committee Compensation CommitteeNominating and Corporate Governance CommitteeChristopher J. Benjamin Compensation Committee Nominating and Corporate
Governance Committee X 

Charles G. KingXStanley M. Kuriyama Douglas M. Pasquale X X X X X Committee Chair10
Committee Chair Mr. Pasquale, ChairmanMr. DoaneMr. Yeaman2015.2016.Mr. King, ChairmanMs. SaitoMs. Wallcompensation to the Board.compensation. The Compensation Committee may form subcommittees and delegate such authority as the Committee deems appropriate, subject to any restrictions by law or listing standard. For further information on the processes and procedures for consideration of executive compensation, see the “Compensation Discussion and Analysis” section below. The Compensation Committee met four times during 2015.2016.Mr. Harrison, ChairmanMr. KingMr. Pasqualefour timestwice during 2015.2016.The Nominating Committee identifies potential nominees by asking current directors to notify the Nominating Committee of qualified persons who might be available to serve on the Board. The Nominating Committee also engages, when appropriate, firms that specialize in identifying director candidates.11(including (including the number of shares owned and the length of time of ownership), the name of the candidate, the candidate’s qualifications to be a director and the candidate’s consent for such consideration.Goals and responsibilities of the BoardSelection of directors, including the Chairman of the BoardBoard membership criteria and director retirement ageStock ownership guidelinesDirector independence, and executive sessions ofnon-management directorsBoard self-evaluationBoard compensationBoard access to management and outside advisorsSelect Corporate Governance Guideline Topics•Goals and responsibilities of the Board•Selection of directors, including the Chairman of the Board•Board membership criteria and director retirement age•Stock ownership guidelines•Director independence, and executive sessions of non-management directors•Board self-evaluation•Board compensation•Board access to management and outside advisors•Board orientation and continuing education•Leadership development, including annual evaluations of the CEO and management succession plans
Leadership development, including annual evaluations of the CEO and management succession plansCode of Ethics. Ethics.A&B has adopted a Code of Ethics (the “Code”) that applies to the CEO, Chief Financial Officer (“CFO”) and Controller. A copy of the Code is posted on the corporate governance page of A&B’s corporate website, www.alexanderbaldwin.com.www. alexanderbaldwin.com. A&B intends to disclose any changes in or waivers from its Code by posting such information on its website.. Conduct.A&B has adopted a Code of Conduct, which is applicable to all directors, officers and employees, and is posted on the corporate governance page of A&B’s corporate website, www.alexanderbaldwin.com.12. Engagement.A&B values the views of its shareholders. Members of our management team met or offered to meet with shareholders during 20152016 owning a significant percentage of our stock to discuss our operations, corporate governance, executive compensation and environmental initiatives and to solicit feedback on these and a variety of other topics. Shareholder perspectives are shared with the Board.Kuriyama,Benjamin, whose compensation is included in the Summary Compensation Table and Mr. Benjamin, who became a director as of January 1, 2016)Table) for services as a member of our Board of Directors for the period from January 1, 20152016 through December 31, 2015 (except for Mr. Hulihee, who retired as an employee of the Company on December 31, 2015 and did not receive compensation for serving as a director).20152016.Name FeesEarned orPaid inCash($)StockAwards($) (1) OptionAwards($) (2)Non-Equity Incentive Plan Compen-sation ($) Change in Pension Value and Nonqualified DeferredCompen-sationEarnings($) All Other Compen-sation($) Total($)(a) (b) (c) (d) (e) (f) (g) (h) W. Allen Doane 65,260 90,035 0 0 N/A 2,000 (3) 154,295 Robert S. Harrison 68,029 90,035 0 0 N/A 0 158,064 David C. Hulihee (5)0 153,474 (6) 0 195,562 (7) 0 432,514 (8) 781,550 Charles G. King 96,396 90,035 0 0 0 (9) 0 186,431 Douglas M. Pasquale 85,750 90,035 0 0 N/A 0 175,785 Michele K. Saito 64,250 90,035 0 0 N/A 0 154,285 Jeffrey N. Watanabe (4)30,317 0 0 0 N/A 200 (3) 30,517 Jenai S. Wall 42,915 90,035 0 0 N/A 0 132,950 Eric K. Yeaman 65,000 90,035 0 0 N/A 0 155,035 Fees
Earned or
Paid in
Cash
($) Stock
Awards
($) (1) Option
Awards
($) (2) Non-Equity
Incentive Plan
Compensation
($) Change in
Pension
Value and
Nonqualified
Deferred
Compensation
Earnings
($) All Other
Compensation
($) Total
($) (a) (b) (c) (d) (e) (f) (g) (h) 67,250 90,028 0 0 N/A 0 157,278 71,000 90,028 0 0 N/A 0 161,028 58,250 90,028 0 0 N/A 211,424 (3) 359,702 106,750 90,028 0 0 629 (4) 0 197,407 385,000 (5) 134,976 (5) 0 0 N/A 9,950 (6) 529,926 87,250 90,028 0 0 N/A 30,000 (7) 207,278 65,750 90,028 0 0 N/A 0 155,778 65,750 90,028 0 0 N/A 0 155,778 66,500 90,028 0 0 N/A 0 156,528 (1) Represents the aggregate grant-date fair value of restricted stock unit awards granted in 20152016 as computed under ASC Topic 718. See discussion of the assumptions underlying the valuation of equity awards included in noteNote 13 of the Company’s consolidated financial statements, included in the Company’s 20152016 Annual Report on Form10-K. At the end of 2015,2016, Mr. King had 32,36134,670 restricted stock units, Messrs. Doane, Harrison, Pasquale and Yeaman and Ms. Saito each had 4,6504,555 restricted stock units, Ms. Wall had 3,755 restricted stock units, Mr. Hulihee had 3,1223,558 restricted stock units and Ms. Wall1,873 performance stock units, and Mr. Kuriyama had 2,16913,138 restricted stock units and 8,679 performance stock units.(2) At the end of 2016, Mr. Kuriyama had 477,737 stock option awards outstanding. No other director has anyout- standing options and no new director options have been granted by A&B or by A&B Predecessor since 2007. The aggregate number of stock option awards outstanding at the end of 2015 for each director is as follows: Mr. Doane, Mr. Harrison, Mr. Hulihee, Mr. Pasquale, Ms. Saito, Ms. Wall and Mr. Yeaman – 0 shares and Mr. King – 16,422 shares.(3) Represents charitable contributionsthe amount paid to Mr. Hulihee under the matching gifts programa consulting agreement of $200,000 plus 4.712% general excise tax ($9,424), as described on page 15 below.(4)Under A&B’s retirement policy for directors, Mr. Watanabe retired from the Board of Directors on April 28, 2015.(5)Mr. Hulihee was an employee of A&B and accordingly did not receive compensation for serving as a director. He retired as an employee of A&B on December 31, 2015.(6)Represents the 2015 grant under the Alexander & Baldwin, Inc. 2012 Incentive Compensation Plan while Mr. Hulihee was an employee of A&B.(7)Represents the payout for 2015 under the Alexander & Baldwin, Inc. Performance Improvement Incentive Plan (“PIIP”) while Mr. Hulihee was an employee of A&B.13(8)Represents the salary paid to Mr. Hulihee20 below, and charitable contributions under the matching gifts program described on page 15 below while Mr. Hulihee was an employee of A&B.16 below.(9)(4)Mr. King’s amount is attributable to the aggregate change in the actuarial present value of his accumulated benefit under a defined benefit pension plan for directors, which was frozen in 2004. The change in pension value was a decrease of $14,239. No other A&B director is eligible to obtain benefits fromparticipate in the plan.(5) Represents compensation paid to Mr. Kuriyama as executive Chairman of the Board. (6) Represents charitable contributions under the matching gifts program described on page 16 below and amounts contributed by A&B under the A&B Individual Deferred Compensation and Profit Sharing Plan. (7) Represents partial reimbursement of professional fees and related costs incurred in determining the applicability of a local excise tax to anon-resident director. Willis Towers Watson & Co. (“Towers Watson”).Pay ElementAmountAnnual Board Retainer$56,000Lead Director Retainer (additional)$25,000Committee Chair Retainers (in addition to committee member retainer)•Audit•Compensation•Nominating and Corporate Governance$14,000$10,000$7,500Committee Member Retainers (additional)•Audit•Compensation•Nominating and Corporate Governance$9,000$7,500$6,000Annual Equity Award$90,000WTW. Amount $ 56,000 $ 25,000 $ 14,000 $ 10,000 $ 7,500 $ 9,000 $ 7,500 $ 6,000 $ 90,000 Board – 7 meetingsAudit – 6 meetingsCompensation – 5 meetingsNominating and Corporate Governance – 4 meetings2015.2016. Directors who are employees of A&B or its subsidiaries do not receive compensation for serving as directors. Mr. Kuriyama, who became Chairman of A&B (in an executive capacity) on January 1, 2016, received compensation of $385,000 and an equity award of $135,000 for service as Chairman. Mr. Kuriyama, who transitioned tonon-executive Chairman of A&B on January 1, 2017, will receive for 2017 annual cash compensation of $85,000 and be eligible for an equity award of $135,000.14accompanying directorstraveling on A&B business.The Board has adopted guidelines that encourage eachnon-employee director to own A&B common stock (including RSUs) with a value of $280,000, which is five times the current cash retainer of $56,000, within five years of becoming a director. All directors have met or are on track to meet the established guidelines.. Directors.Shareholders and other interested parties may contact any of the directors by mailing correspondence “c/o A&B Law Department” to A&B’s headquarters at 822 Bishop Street, Honolulu, Hawaii 96813. The Law Department will forward such correspondence to the appropriate director(s). However, the Law Department reserves the right not to forward any offensive or otherwise inappropriate materials.20152016 Annual Meeting.18, 201616, 2017 to have owned beneficially more than five percent of A&B’s common stock outstanding, the number of shares they beneficially own, and the percentage of outstanding shares such ownership represents, based upon the most recent reports filed with the SEC. Except as indicated in the footnotes, such shareholders have sole voting and dispositive power over shares they beneficially own.Amount of
Beneficial OwnershipPercent of
Class4,982,948 (a) 10.2 % Name and Addressof Beneficial OwnerAmount ofBeneficial OwnershipPercent ofClass3,545,072 (b) 7.2 % BlackRock, Inc.40 East 52nd StreetNew York, NY 100224,581,841 (a)9.4% 3,144,770 (b)6.4%3,502,853 (c) 7.1 % 3,363,823 (d) 6.9 % 2,623,130 (c)5.4%2,623,130 (e) 5.3 % (a) As reported in Amendment No. 56 to Schedule 13G dated January 20, 20169, 2017 (the “BlackRock 13G”) filed with the SEC. According to the BlackRock 13G, as of December 31, 2015,2016, BlackRock, Inc. has sole voting power over 4,470,0674,883,288 shares and sole dispositive power over 4,581,8414,982,948 shares, and does not have shared voting or shared dispositive power over any shares.(b) As reported in Amendment No. 41 to Schedule 13G dated February 10, 201614, 2017 (the “London Company 13G”) filed with the SEC. According to the London Company 13G, London Company has sole voting power and sole dispositive power over 2,635,053 shares, has shared dispositive power over 910,019 shares and no shared voting power over any shares.(c) As reported in Amendment No. 5 to Schedule 13G dated February 9, 2017 (the “Vanguard 13G”) filed with the SEC. According to the Vanguard 13G, as of December 31, 2015,2016, The Vanguard Group has sole voting power over 60,17275,103 shares and sole dispositive power over 3,083,9983,423,950 shares, has shared voting power over 3,1006,100 shares, and has shared dispositive power over 60,77278,903 shares.(d) As reported in Schedule 13G dated February 7, 2017 (the “T. Rowe 13G”) filed with the SEC. According to the T. Rowe 13G, T. Rowe Price Associates has sole voting power over 436,792 shares and sole dispositive power over 3,363,823 shares and does not have shared voting or shared dispositive power over any shares. (c)(e)As reported in Schedule 13D dated September 11, 2015 (the “EJF 13D”) filed with the SEC. According to the EJF 13D, as of September 11, 2015, EJF Capital LLC has shared voting power and shared dispositive power over all 2,623,130 shares and has no sole dispositive power or sole voting power over any shares. 1518, 201616, 2017 by each director and nominee, by each executive officer named in the “Summary Compensation Table” below, and by directors and executive officers as a group and, if at leastone-tenth of one percent, the percentage of outstanding shares such ownership represents. Except as indicated in the footnotes, directors, nominees and executive officers have sole voting and dispositive power over shares they beneficially own.Name or Number in Group Number of Shares Owned (a)(b) Stock Options (c) Total Percent of Class W. Allen Doane 74,608 0 74,608 0.2 Robert S. Harrison 5,855 0 5,855 -- David C. Hulihee 2,272,651 0 2,272,651 4.6 Charles G. King 44,015 16,422 60,437 0.1 Douglas M. Pasquale 33,738 0 33,738 0.1 Michele K. Saito 5,855 0 5,855 -- Jenai S. Wall 0 0 0 -- Eric K. Yeaman 5,855 0 5,855 -- Stanley M. Kuriyama 233,626 517,547 751,173 1.5 Christopher J. Benjamin 88,564 146,460 235,024 0.5 Paul K. Ito 11,906 79,679 91,585 0.2 Nelson N. S. Chun 63,584 87,594 151,178 0.3 Meredith J. Ching 46,674 84,302 130,976 0.3 15 Directors and Executive Officers as a Group 2,895,519 933,156 3,828,675 7.7 Number of Shares
Owned (a)(b) Stock Options (c) Total Percent of Class 47,012 0 47,012 0.1 8,259 0 8,259 — 2,273,503 0 2,273,503 4.6 48,114 0 48,114 0.1 209,501 477,737 687,238 1.4 36,142 0 36,142 0.1 8,259 0 8,259 — 723 0 723 — 8,259 0 8,259 — 93,106 146,460 239,566 0.5 22,405 69,350 91,755 0.2 72,505 66,671 139,176 0.3 51,764 76,340 128,104 0.3 5,169 1,152 6,321 — 2,891,882 837,710 3,729,592 7.6 (a) Amounts include 20,000 shares held in a trust by the spouse of Mr. Benjamin, 150 shares held by the spouse of Ms. Ching and 76,000 shares pledged by Mr. Kuriyama as security for a loan. (b) Amounts include shares as to which certain persons have (i) shared voting and dispositive power, as follows: Mr. Hulihee – 2,000 shares, Mr. Pasquale – 33,73836,142 shares, Ms. Ching – 2,800 shares, and directors, nominees and executive officers as a group – 38,53840,942 shares and (ii) sole voting power only: Ms. Ching – 391,393 shares, and directors and executive officers as a group – 391393 shares.(c) Amounts reflect shares deemed to be beneficially owned because they may be acquired prior to April 18, 201616, 2017 through the exercise of stock options. Amounts do not include 198,461220,140 restricted stock units that have been granted to the directors and executive officers as a group that may not be acquired prior to April 18, 2016.16, 2017.2015,2016, its directors and executive officers filed all reports required to be filed under Section 16(a) on a timely basis.A&B has adopted a written policy under which the Audit Committee mustpre-approve all related person transactions that are disclosable under Item 404(a) of SEC RegulationS-K. Prior to entering into a transaction with A&B, directors and executive officers (and their family members) must make full disclosure of all facts and circumstances to the Law Department. The Law Department then determines whether16such transaction requires the approval of the Audit Committee. The Audit Committee considers all of the relevant facts available, including (if applicable) but not limited to: the benefits to the Company; the impact on a director’s or executive’s independence, an immediate family member of a director or executive or an entity in which a director or executive is a partner, shareholder or executive officer; the availability of other sources for comparable products or services; the terms of the transaction; and the terms available to unrelated third parties or to employees generally. The Audit Committee will approve only those related person transactions that are in, or are not inconsistent with, the best interests of the Company and its shareholders. If a related person transaction involves a member of the Audit Committee, that member recuses himself or herself from the process of review and approval.second largest owner of grocery-anchored retail assets, one of the largest materials and construction companiescompany in the state, and given its active role as one of the state’s largestpremier real estate developers, it is to be expected that relationships will exist between the Company and key business leaders and their companies, as disclosed below. The transactions described were made in the ordinary course of business, on substantially the same terms as those made with persons not related to A&B.Bank: Bank:Robert S. Harrison and Eric K. Yeaman, directors of A&B, are Chairman and Chief Executive Officer, and President and Chief Operating Officer, respectively, of FHB.FHB is the largest bank in Hawaii and is thetop-ranked Hawaii bank in commercial and industrial lending and in construction and land development loans.FHB has been a lending partner to the Company and its predecessor for many years prior to Messrs. Harrison and Yeaman joining the Board.Mr. Yeaman was a member of the Board for three years prior to joining FHB in 2015. Upon joining FHB, he reported his change in employment to the Board; the Board reviewed the change, including consideration of relationships with FHB and Mr. Yeaman’s skill set and contributions to the Board, and approved his continued service on the Board.The Audit Committee reviews all FHB related person transactions.All transactions were made in the ordinary course of business, on commercially reasonable, prevailing terms and rates.20.419.3 percent participation in A&B’s $350 million revolving credit and term loan agreement (the “Revolver”), of which, in 2015,2016, the largest aggregate amount of principal outstanding was $155,000,000; $171,000,000$180,000,000; $184,000,000 and $2,990,000$2,503,754 were paid in principal and interest, respectively, to Revolver lenders that include FHB; and $155,300,000$23,000,000 was outstanding on February 18, 2016,16, 2017, with interest payable on a sliding scale at rates between 1.35 percent to 2.15 percent (based on A&B’s Total Debt to Total Assets, as defined in the loan agreement) plus LIBOR, (ii) has a 34.5 percent participation in a $177 million construction loan made to a limited liability company in which a subsidiary of A&B is a member, of which, in 2015,2016, the largest aggregate amount of principal outstanding was $4,352,000;$125,937,000; and no amounts$129,298,000 and $2,112,000 were paid in principal and interest to lenders that include FHB; and $24,300,000 was outstanding on17February 18, 2016, with interest payable at a rate of LIBOR plus 3 percent, (iii) has a 41.7 percent participation in a $120 million construction loan made to a limited liability company in which a subsidiary of A&B is a member, of which, in 2015, the largest aggregate amount of principal outstanding was $76,272,000; $76,272,000 and $257,000 were paid in principal and interest, respectively, to lenders that include FHB, with interest payable at a rate of LIBOR plus 3 percent; and no amount was outstanding on February 18, 201616, 2017 as the loan was paid off in January 2015, (iv)December 2016, (iii) has a $5,000,000 loan made to a limited liability company in which a subsidiary of A&B is a member, of which, in 2015,2016, the largest aggregate amount of principal outstanding was $4,664,000; $192,000$4,472,000; $212,000 and $145,000$161,000 were paid in principal and interest, respectively; and $4,456,000$4,257,000 was outstanding on February 18, 2016,16, 2017, with interest payable at a rate of LIBOR plus 2 percent, and of which a subsidiary of A&B is a guarantor in the amount of the lesser of $3.15 million or the outstanding indebtedness, (v)(iv) has a $42,000,000 loan made to a subsidiary of A&B, of which, in 2015,2016, the largest aggregate amount of principal outstanding was $35,225,000; $26,995,000$8,230,000; $8,230,000 and $519,000$244,000 were paid in principal and interest, respectively; and $8,229,000no amount was outstanding on February 18,16, 2017 as the loan was paid off in December 2016, with interest payable at a rate of LIBOR plus 2.625%, and of which a subsidiary of A&B is a limited guarantor, (vi)(v) has a $11,700,000 loan made to a limited liability company in which a subsidiary of A&B is a member, of which, in 2015,2016, the largest aggregate amount of principal outstanding was $11,667,000; $0 and $215,000$409,000 were paid in principal and interest, respectively; and $11,667,000 was outstanding on February 18, 2016,16, 2017, with interest payable at a rate of LIBOR plus 3.0 percent, (vii)(vi) has a $25,000,000 loan made to a limited liability company in which a subsidiary of A&B is a member, of which, in 2015,2016, the largest aggregate amount of principal outstanding was $2,030,000;$11,643,000; $0 and $4,000$160,000 were paid in principal and interest, respectively; and $2,126,000 was outstanding on February 18, 2016,16, 2017, with interest payable at a rate of LIBOR plus 3.0 percent, and of which a subsidiary of A&B is a guarantor in the amount of the lesser of $2,500,000 or the outstanding indebtedness, and (viii)(vii) is a commercial tenant in three properties owned by A&B subsidiaries, under leases with terms that expire inbetween 2017 and 2063, with aggregate gross rents in 20152016 of $392,000$720,000 and aggregate net rent from and after January 1, 20162017 to the expiration date of the leases of $4,745,000.$8,690,000.Two linesA line of credit totaling $32,000,000$2,000,000 with a limited liability companies,company in which a subsidiary of A&B is a 70 percent and a 50 percent member, of which, in 2015, the largest aggregate amount of2016, there was no principal outstanding was $21,600,000; $21,600,000 and $96,000 were paid in principal and interest, respectively;outstanding; and no amount was outstanding on February 18, 2016,16, 2017, with interest payable at rates between 1.82 percent to 2.25 percent plus LIBOR (the line of credit totaling $30 million was terminated and replaced with a line of credit from another financial institution in February 2015);LIBOR; (ii) an $18,000,000 loan, of which, in 2015,2016, the largest aggregate amount of principal outstanding was $10,185,000; $1,819,000$8,366,000; $1,915,000 and $492,000$395,000 were paid in principal and interest, respectively; and $8,211,000$6,123,000 was outstanding on February 18, 2016,16, 2017, with interest payable at a rate of 5.18 percent; and (iii) a $13,500,000 loan, of which, in 2015,2016, the largest aggregate amount of principal outstanding was $8,029,000; $2,701,000$5,327,000; $2,752,000 and $127,000$77,000 were paid in principal and interest, respectively; and $4,872,000$2,112,000 was outstanding on February 18, 2016,16, 2017, with interest payable at a rate of 1.85 percent.fiveseven properties owned by A&B subsidiaries, under leases with terms that expire between20152016 of $3,854,000$4,107,000 and aggregate net rent from and after January 1, 20162017 to the expiration date of the leases of $10,609,000.$14,110,000. These leases were entered into in the ordinary course of business, and all but one were in effect prior to the election of Ms. Wall as a director and were entered into in the ordinary course of business.Eric K. Yeaman, a director of A&B, was President, Chief Executive Officer and Director of Hawaiian Telcom until June 2015. A limited liability company (“LLC”) in which a subsidiary of A&B is a member, developed a high-rise condominium project in Honolulu. In 2012, the LLC entered into a contract (entered into in the ordinary course of business) under which Hawaiian Telcom provided for the project wiring and other communication infrastructure valued at18approximately $1.25 million as part of a five-year contract to provide cable and internet service at an annual base price of approximately $200,000. Mr. Yeaman ceased his employment with Hawaiian Telcom in June 2015.David C. Hulihee -- Koko'oha Investments, Inc. Matters: A&B acquired Grace Pacific as of October 1, 2013 under an Agreement and Plan of Merger between the Company, A&B II, LLC, GPC Holdings, Inc., Grace Pacific Corporation and Mr. Hulihee. Koko'oha Investments, Inc. ("Koko'oha"), a wholly-owned Grace Pacific subsidiary, engaged in the petroleum and retail gasoline businesses, was spun-off from Grace Pacific and was not acquired by A&B. Mr. Hulihee (both individually and through affiliated entities or immediate family members) owned or partially controlled approximately 38.7% of Koko'oha prior to its sale in 2015. Certain continuing obligations existed between the Company or Grace Pacific and Koko'oha, including tax-related obligations under a tax matters agreement entered into in connection with the spin-off. In addition, a subsidiary of Koko'oha has a commercial lease with a subsidiary of A&B. Gross rent paid in 2015 while Mr. Hulihee had an interest in Koko’oha was $83,015. Mr. Hulihee no longer owns any interest in Koko’oha, having disposed of his interest on March 31, 2015.director.will provideprovided services in connection with the operation of Grace and its subsidiaries, including assisting in leadership transition, operating performance and government and community affairs. The agreement iswas for $200,000, plus 4.712% general excise tax ($9,424) for the period January 1,calendar year 2016, throughand terminated on December 31, 2016.20152016 for the five executive officers named in the Summary Compensation Table on page 3335 (collectively, the “Named Executive Officers” or “NEOs”). The NEOs are:Stanley M. Kuriyama, Chairman of the Board & Chief Executive Officer of A&B*Christopher J. Benjamin, President and Chief OperatingExecutive Officer, A&B*&BPaul K. Ito, Senior Vice President, Chief Financial Officer and Treasurer, A&B**&BNelson N. S. Chun, Senior Vice President and Chief Legal Officer, A&BMeredith J. Ching, Senior Vice President, Government & Community Relations, A&B
Lance K. Parker, President, A & B Properties Hawaii, LLC (“ABP”)* Effective January 1, 2016, Mr. Kuriyama retired from his role as CEO but retains his role as Chairman while Mr. Benjamin was appointed CEO.** Mr. Ito also was Controller through August 2015.2015,2016, our executive compensation program received strong support from shareholders, with over 97% of theSay-on-Pay votes cast in approval of the program. We believe this is because our pay program links pay with performance, aligns pay with shareholder interests and follows good governance practices. The vote on executive compensation is just one source of insight regarding shareholder views on our compensation practices. A&B also has an extensive shareholder outreach program that incorporates discussion of various governance topics, including compensation. In 20152016 we met or offered to meet on governance-focused matters with shareholders owning a significant percentage of our stock on governance-focused matters.stock. The feedback we received regarding our compensation practices was very positive. The Compensation Committee welcomes shareholder perspectives on our program and is informed regarding feedback gathered in discussions with shareholders.19performance basedperformance-based equity awards provisions• provisions2015. The2016.2016 represented a year of significant change for the Company. In early 2016, the Company announced that it would exit its sugar business after 146 years of sugar cultivation. Throughout the year, the Company made significant progress toward the Company’s strategic objectives to simplify its business model, focus on growing the cash flow and portfolio value of its commercial real estate assets, accelerate the mon-etization of the development pipeline, and adhere to disciplined and prudent financial management. In late 2016, the Company announced it would conduct anin-depth evaluation of a real estate investment trust (REIT) structure. Leasing and Real Estate Development segments performed well, generating $118.1 million in operating profit. The Company’sand Sales, Materials &and Construction, segment also performed well, posting operating profit of $30.9 million. The Company’s Agribusiness segment, however, suffered from production challenges and its financial results were further impacted by the Company’s decision to shut down the sugar operations. The Agribusiness segment operating loss, which includes cessation-related costs, totaled $51.9 million for the year, partially offsetting the strong performance of the Company’s other segments.Agribusiness. As a result net income declined to $29.6 millionof the segment reorganization, the Company’s former Real Estate Development and Sales and Agribusiness segments have been combined into the Land Operations reportable segment. Additionally, the following items were realigned in 2015, compared to $61.4 million in 2014. Revenues in 2015connection with the segment changes: (1) agricultural leases that were $570.5 million, an increase of $10.5 million, compared to 2014 revenues of $560.0 million.20In 2015, A&B continued to focus on and increase its asset base in Hawaii. The Company’s value creating strategies include growing, and advancing key projectspreviously included in the development pipeline; maximizingCommercial Real Estate segment were reclassified to the value ofLand Operations segment, (2) certain industrial leases that were previously included in the Company’s commercial portfolio, including continued migrationformer Agribusiness segment were reclassified to the Commercial Real Estate segment, (3) sales of commercial properties fromthat were previously included in the U.S. Mainland to Hawaii; securing superior investments in real estate and in complementary businesses; and employing the Company’s 88,000 acres in Hawaii at their highest and best use. These strategies position A&B for future success as the Hawaii economy and real estate markets continue to improve.Theformer Real Estate Development and Sales segment performed well.were reclassified to the Commercial Real Estate segment, and (4) the Company’s solar energy investments that were previously presented as Corporate investments were reclassified to Land Operations. The Waihonua high-rise condominium project was completed successfullythree reportable segments (Commercial Real Estate, Land Operations, and Materials and Construction), as realigned and presented, reflect the revised operational structure and internal management reporting. The financial information for all units were deliveredprior periods have been recast to their ownerscorrespond to these segment changes. Refer to pages 44 to 46 for the reconciliations of GAAP tonon-GAAP measures, including financial measures, as reported under the realigned segments, to the corresponding financial measures as reported under the previous segment presentation.January 2015. All 450 high-Safeway and mid-rise units at The Collection,Longs/CVS. This acquisition expanded this portfolio to a 464-unit condominiumstrategic location in urban Honolulu have been sold under binding contract. 21 of 30 lotsand furthered A&B’s position as the No. 1 strip retail center owner in Hawaii. Additionally, due to the success in the Company’s portfolio of upscale residential lots in Kahala have been sold, all at favorable prices. Significant progress also was made at Kukui’ula, A&B’s resort residential development on Kauai, at Wailea, a premier resort destination being developed by A&B on Maui’s south shore, and at Maui Business Park II, the Company’s business park in central Maui.The Real Estate Leasing segment performed well. Year-over-year commercial portfolio net operating income increased by 8.5% and operating profit increased by 11.8%. Due to major strides in migrating the portfoliomigration to Hawaii, more thanover 80% of net operating income (NOI) is now generated from Hawaii assets, up from approximately 40% three years ago.in 2012.• Grace Pacific was a solid contributorOperating profit of $54.8 million from the commercial real estate portfolio increased 3.0% in 2016 compared to 2015, cash flow, generating $41.0and net operating income (NOI)1 of $86.4 million from the portfolio increased 2.9% in 2016 compared to 2015.Renewed 142 expiring leases, or 14.9% of gross leasable area, in 2016 at an average increase of 13.2% in annualized base rent per square foot.Completed the 18,415 square-foot expansion of Gateway at Mililani South at a 13% stabilized yield on cost of $6.0 million. The expanded space is now 100% leased.Commenced redevelopment efforts at Lau Hala Shops (former Kailua Macy’s site) and Pearl Highlands food court in 2016, with a planned completion date in late 2017. Leases and letters of intent have been signed for 87% of the space at Lau Hala Shops and letters of intent have been signed for 60% of the space at Pearl Highlands. These redevelopments, when completed, are expected to provide attractive yields.Closed on unit sales at the Company’s high-rise condominium joint venture project, The Collection, delivering 451 units to their owners and generating sales revenue of $303.8 million for the joint venture. The Collection represented the largest condominium project closed in Hawaii in 2016.Closed on the sale of twonon-oceanfront lots on Kahala Avenue for $7.0 million, and sold three vacant Maui parcels for $27.7 million, with proceeds of $9.9 million designated for reinvestment in commercial properties under 1031 exchange transactions.Ended the year with 49 bindingpre-sales at the Company’s70-unit joint venture project, Keala ‘O Wailea, on Maui at an average price of $1.2 million.Successfully completed the last sugar harvest at HC&S, incurring exit costs that were significantly below initial estimates.Commenced the transition to diversified agriculture, with numerous trials underway, including cattle and various energy crops.1 Refer to pages 44 to 46 for reconciliations of GAAP to non-GAAP measures. • Generated $23.3 million in operating profit and $33.2 million in EBITDA2 despite at Materials & Construction in 2016. 2016 operating profit includes environmental costs of $2.6 million related to the major drop in oil prices, which significantly reduced margins at Grace’s asphaltmanagement of a former quarry site, as well as a net loss of $1.0 million related to the sales business, a slower-than-anticipated pace of jobs released for commencement of construction, and weather-related impacts.vacant land parcels by an unconsolidated affiliate.
Ended 2016 with a $242.9 million backlog compared to $226.5 million at the end of 2015.Commenced anin-depth evaluation of converting to a real estate investment trust.Locked in $60 million of long-term secured debt at an attractive rate of 3.14% with a term of 13 years.20152016 was determined to be between threshold and target and was reflected in elements of compensation earned by executives for 2015.2016.• Base Salary:NEO salaries range from the 25th to the 50th percentiles of competitive market rates. • Target Total Cash (“TCC”):Target Total Cash consists of base salary plus target annual cash incentives. NEO TCC ranged from the 25th to the 50th percentiles. Actual annual incentive amounts earned reflect Company performance between threshold and target (as described below in “Company and Business Unit Performance” and “Value Creation”). Actual total cash compensation paid to the NEOs ranged from the 25th to the 50th percentiles. 2Refer to Page 42 for a reconciliation from GAAP to non-GAAP measure for EBITDA.21Company performance between threshold and target (as described below in “Company and Business Unit Performance” and “Value Creation”). Actual total cash compensation paid to the NEOs ranged from the 25th to the 50th percentiles.• Long-term Incentives (“LTI”):NEO LTI ranged from the 25th to the 50th percentiles. The Performance Share Units (“PSUs”) granted in 20142015 were based uponevenly divided into two tranches:two-year performance and vesting horizons and three-year performance and vesting horizons. From 2016 on, PSUs grants have three-year performance and vesting horizons. For the Company’s achievement of pre-set goals for total shareholder return over a two-year performance period. 0%portion of the units granted2015 grant that had atwo-year performance and vesting horizon, 86.5% of the shares were earned based on the Company’s performance over the performance period.earned.• Total Direct Compensation (“TDC”):TDC for the NEOs ranged from the 25th percentile to the 50th percentile. Actual TDC earned by the NEOs ranged from the 25th percentile to the 50th percentile. Towers WatsonWTW to provide advice and analysis on the design, structure and level of executive compensation for A&B.2 Refer to pages 44 to 46 for reconciliations of GAAP to non-GAAP measures. CompositionMetricsRationale Base Salary Cash -— Annual Cash Incentives Cash 34% Value Creation56.25% Financial Operating Goals43.75% Value Creation 66% Financial Operating GoalsLong-Term Incentives 50% Performance Share Units 2-year and 3-year TSR (S&P 400 50% Restricted Stock Units 3-year vesting period Health and Welfare Benefits -— Retirement Benefits -— Severance Benefits -— 22Mix. Mix.The Company’s combination of pay elements is designed to place greater emphasis on performance-based compensation, while at the same time focusing on long-term talent retention and ensuring an appropriate balance between pay and risk. The Committee believes this is consistent with one of its key compensation objectives, which is to align management and shareholder interests. For 2015,2016, the TDC mix was generally within the same range as competitive practices based on survey data for each element of pay, as shown by the table below. following table.
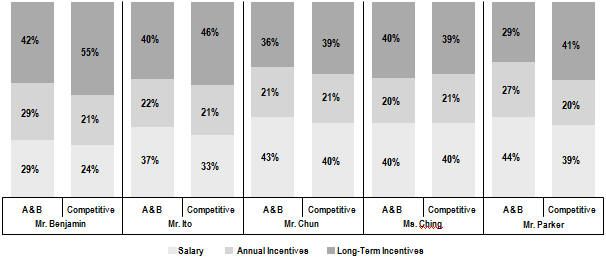
•Accrued benefits balancesPositioning in relation to the pay philosophy•Projected salary increases in the general industry•Value of the total pay package•Alignment to pay for performance•Reasonableness and balance of pay risk•Internal pay equity•NEO’s current and expected future contributionsEquity. Equity.The Compensation Committee considers internal pay equity as a factor in establishing compensation for executives. While the Compensation Committee has not established a specific policy regarding the ratio of total compensation of the CEO to that of the other executive officers, it does review compensation levels to ensure that appropriate internal equity exists. In 2015,2016, it reviewed the ratio of the CEO’s salary, TCC and TDC relative to the average compensation for the other NEOs, as reflected in the table below.following table. These ratios also were also compared to benchmark survey data to determine whether compensation relationships are consistent with market practices. The Company’s target and actual ratios were within a reasonable range and reflect a lower ratio between the CEO and other NEOs than that of companies of similar size in general industry.232015 Salary Total CashCompensationTotal DirectCompensationA&B Target 1.52 2.00 2.02 A&B Actual* 1.52 1.81 1.90 Benchmark Data (target) 2.08 2.54 3.79 * Based on base salary as of December 31, 2015, actual annual incentives paid in 2015 for 2014 performance and grant date value of the long-term incentive grants made in January 2015. Salary Total Cash
Compensation Total Direct
Compensation 1.91 2.46 2.56 1.91 1.82 2.19 2.15 2.60 3.37 * Based on base salary as of December 31, 2016, actual annual incentives paid in 2016 for 2015 performance and grant date value of the long-term incentive grants made in January 2016. Salary:five key categories:categories such as, but not limited to: financial performance results, strategic effectiveness and innovation, business management, talent management, and personal effectiveness. None of the categories is formally weighted, and there is no overall rating score. Each Board member provides written observations and rateshas an opportunity to provide input on the CEO’s performance against the criteria. The Board of Directors discusses the results of the assessment with the CEO, including the areas of greatest strength and areas where improvements could be made.. The result of this process is considered by the Board in determining the CEO’s actualannual salary.20152016 reflected increases based on performance and the factors listed in the20142015 - 2015NEO Base Salary asof 12/31/14% Change Base Salaryas of 12/31/15EstimatedCompetitiveMarket PercentileMr. Kuriyama $525,000 3% $540,750 25th percentileMr. Benjamin $452,262 3% $465,830 50th percentileMr. Ito $350,175 3% $360,680 50th percentileMr. Chun $312,959 3% $322,348 50th percentileMs. Ching $263,900 3% $271,817 50th percentile2016 Estimated Base Salary as Base Salary Competitive of 12/31/15 % Change as of 12/31/16 Market Percentile $ 465,830 33 %* $ 618,000 45th percentile $ 360,680 3 % $ 371,500 50th percentile $ 322,348 3 % $ 332,018 50th percentile $ 271,817 3 % $ 279,972 50th percentile $ 300,000 3 % $ 309,000 50th percentile * Reflects an increase based on Mr. Benjamin’s new position as Chief Executive Officer, effective January 1, 2016. 2015,2016, annual incentives for NEOs were provided through the Alexander & Baldwin, Inc. Performance Improvement Incentive Plan (“PIIP”) to motivate executives and reward them if they achieve specificpre-established24pre-established corporate and business unit goals and for creating value for the Company. The financially oriented goals were established in February 2015.2016. A rating for “Value Creation” (as described below) was assessed by the CEO after the 20152016 performance period.For 2015, A&B used Real Estate Development & Sales Gross Margin and Leasing net operating income (“NOI”) for its Properties business segment; Pre-Tax Income for its Agribusiness segment; EBITDA and construction backlog for its Materials & Construction segment; and Value Creation as the performance measures for the NEOs’ PIIP awards that ultimately determine the aggregate amount of incentives that are funded to the incentive pool. Gross Margin, NOI, Pre-Tax Income, EBITDA and construction backlog were selected because the Company believes they best reflect the results of business execution and profitability levels of the respective segments, while Value Creation is a subjective rating by the CEO that is reviewed with the Compensation Committee based on the performance and accomplishments of the Company that create long-term value for shareholders but are not necessarily reflected in annual financial results.• For 2016, A&B used Real Estate Development & Sales Gross Margin, Commercial Real Estate Same-Store3 Adjusted NOI, and Total Commercial Real Estate Adjusted NOI for its real estate operations; EBITDA and construction backlog for its Materials & Construction segment; and a combination of those factors, Consolidated AdjustedPre-Tax Income and Value Creation as the performance measures for the NEOs’ (other than Mr. Parker) PIIP awards that ultimately determine the aggregate amount of incentives that are funded to the incentive pool. These factors were selected because the Company believes they best reflect the results of business execution and profitability levels of the respective segments, while Value Creation is a subjective rating by the CEO that is reviewed with the Compensation Committee based on the performance and accomplishments of the Company that create long-term value for shareholders, but are not necessarily reflected in annual financial results. Mr. Parker’s PIIP award pool funding was based on Real Estate Development & Sales Gross Margin, Commercial Real Estate Same-Store3 Adjusted NOI, Total Commercial Real Estate Adjusted NOI, and Value Creation rating for the real estate operations only. The aggregate amount of the incentive pool can range between 0% to 200% of target based on the achievement of financial goals approved in February and the score for Value Creation. The incentive pool is funded by aggregating the target incentives for each participant in the plan and multiplying that sum by the performance ratings for the applicable measures at below threshold, threshold, target or maximum levels, with proration in between these levels.Each individual’s actual incentive award may be modified from his or her funding level using an individual performance modifier that ranges from 0% to 150%, so long as the aggregate incentive pool established is not exceeded for NEOs and PIIP executives.Aligning with key goals/objectivesFostering a team environment while allowing for flexibility in individual recognitionMotivating and rewarding value creation over both the short and long termPerformance. Performance.The annual corporate and business unit targets are based on the Company’s Board-approved operating plan and adjusted in certain instances to exclude the effect of certain items. When establishing the operating plan, management and the Board of Directors consider the historical performance of the Company, external elements such as economic conditions and competitive factors, Company capabilities, performance objectives, and the Company’s strategic plan. The maximum and threshold performance ranges were determined on the basis of the level of difficulty in achieving the objective and are intended to ensure an enduring standard of performance.2015,2016, the Company’s operating performance was compared to the performance goals approved by the Compensation Committee.25Corporate Goal ($ in millions) Threshold Target Maximum Actual Development & Sales gross margin – Properties* $60.4 $71.1 $85.3 $75.8 Leasing net operating income3– Properties**$78.5 $80.9 $83.3 $81.1 EBITDA3 –Materials & Construction***$39.0 $43.3 $49.8 $40.9 Construction backlog –Materials & Construction $219.4 $235.9 $252.3 $226.5 Pre-tax income (loss) – Agribusiness*** ($7.6) ($5.6) $ - ($50.0) Value Creation – Blended 1.0 2.0 3.0 1.54 * Exclusive of commercial property sales.** Exclusive of the impact from certain commercial property acquisitions and dispositions*** Adjusted for over- or under-accrual of performance-based compensation.3 The Company defines same-store as representing properties that were owned throughout the entire duration of both periods under comparison, including stabilized properties. Threshold Target Maximum Actual $ 71.2 $ 74.9 $ 78.6 $ 75.2 $ 80.5 $ 84.7 $ 88.9 $ 86.4 $ 58.7 $ 69.0 $ 82.8 $ 37.8 $ 40.1 $ 44.6 $ 51.2 $ 33.2 $ 226.5 $ 240.1 $ 253.7 $ 242.9 $ 90.2 $ 100.2 $ 115.2 $ 67.3 1.0 2.0 3.0 2.26 the NEOsMr. Benjamin, Mr. Ito, Mr. Chun, and Ms. Ching was based on a weighted mix of (a) the level of achievement of the financial and operating goals set for each offorth in the operating segments (NOI for Leasing, pre-tax income for Development and Sales, pre-tax income for Agribusiness, and EBITDA and construction backlog for Materials & Construction),table above and (b) the scores awarded for value creationValue Creation accomplishments achieved by each of the operating segments and the parent company. The incentive compensation for Mr. Parker was based on Real Estate Development & Sales Gross Margin, Commercial Real Estate Same-Store Adjusted NOI, Total Commercial Real Estate Adjusted NOI, and Value Creation rating for real estate operations only.20152016 performance shown above, the NEOs received scores for financial and operating goals ranging from 0 to 2.32.41 on the various metrics, and a blended score of 1.542.26 for Value Creation accomplishments. The financial and operating goals account for 66%56.25% of four of the NEO’s total incentive award, and Value Creation accounts for the remaining 34%43.75% as the result for Corporate takes into account performance against business unit goals. Mr. Parker’s award is based on Properties goals, which are comprised of 70% real estate operations financial goals and 30% real estate operations Value Creation (score: 2.25).createadvance value creation for shareholders but areshareholders. The Company has two primary goals for Value Creation: increasing net asset value (“NAV”) and enhancing the market’s appreciation of NAV. Accordingly, value creation may or may not necessarily reflectedbe included in 2015 financial results.Value Creation encompasses various activitiesearnings for the current year. Ways to increase NAV include identifying and initiatives that helppursuing redevelopment andbuild-for-hold projects, managing and leasing assets to achieve above-average rent growth in the Company over the shortportfolio, and converting non- to minimal-earning assets into commercial properties with a stable or long term to deliver value to its shareholders,growing income stream. Structural changes, such as buildingevaluating and effecting a REIT conversion, would fall into the pipelinelatter category of development projects, establishing strategic partnerships, joint ventures or alliances, obtaining entitlement and other regulatory approvals for A&B lands, migratingenhancing the Mainland commercial properties to Hawaii, making superior investments in Hawaii real estate or other growth opportunities, achieving sales or leasing results that enhance the valuemarket’s appreciation of the Company’s real estate holdings, progressing towards a new business model for sugar, etc. ItNAV, as would enhanced disclosure. Value Creation is evaluated by the CEO at the conclusion of the year and assigned a rating as described above.20152016 award could be modified between 0% - 150% based on individual performance. The CEO’s performance is reviewed and approved by the Compensation Committee each year. The Committee discussedreviewed the CEO’s performance at its January meeting and rated his overall performance between target and extraordinary. The Committee took into consideration the CEO’s request and rationale for an incentive award that would be below the performance-based calculated amount for 2015. The Committee approved an incentive award of $250,000. $522,675 as funded by operating performance and Value Creation score results. The Committee did not invoke any upward or downward modification to the CEO’s award.4 Refer to pages 44 to 46 for reconciliations of GAAP tonon-GAAP measures. 3Refer to Page 42 for a reconciliation from GAAP to non-GAAP measures for NOI and EBITDA.26NEO Target Bonus Actual Bonus Actual as a % of Target % of Base Salary $ % of Base Salary $ Mr. Kuriyama 105% $567,788 46.2% $250,000 44.0% Mr. Benjamin 60% $279,498 47.3% $220,182 78.8% Mr. Ito 60% $216,408 47.3% $170,482 78.8% Mr. Chun 50% $161,174 39.4% $126,970 78.8% Ms. Ching 50% $135,909 39.4% $107,066 78.8% Target Bonus Actual Bonus Actual as a % of % of Base Salary $ % of Base Salary $ Target 100 % 618,000 85 % $ 522,675 85 % 60 % 222,900 51 % $ 188,520 85 % 50 % 166,009 42 % $ 140,404 85 % 50 % 139,986 42 % $ 118,394 85 % 60 % 185,400 48 % $ 148,505 80 % Compensation:Compensation:Towers Watson,WTW, the CEO makes recommendations for each executive officer to the Compensation Committee, which retains full authority to set the actual grant amount. In determining the type and size of a grant to an executive officer, the Compensation Committee generally considers, among other things, the items mentioned above in the2015,2016, the Company issued equity awards with a mix of 50% Performance Share Units (“PSUs”)PSUs and 50% Restricted Stock Units (“RSUs”).RSUs.PSUs are settled in shares and have both a performance- and service-vesting requirement. The performance requirement is based on A&B’s TSR results relative to the TSR of companies that comprise two indices to which the Company belongs: the Standard & Poor’s Midcap 400 index and the Russell 2000 index. Half of the PSUs granted will be evaluated against the companies comprising the S&P Midcap 400 and half will be evaluated against companies comprising the Russell 2000. In addition, the performance and vesting horizons are beingwere increased from two to three years. Theyears in 2015 for half of the PSUs were evenly divided into PSUs that have two-year performance and vesting horizons and PSUs that have three-year performance and vesting horizons.granted. From 2016 on, PSUs awarded will have three-year performance and vesting horizons. Under the service-vesting requirement, recipients must remain employed until the end of the performance period to earn any shares that become issuable.Pro-rata vesting will apply to the extent employment ceases with the Company during the performance period by reason of death, disability or retirement, with proration to be applied to the number of shares resulting from the Company’s relative TSR over the performance period. PSUs are intended to motivate recipients to focus on A&B shareholder returns with an objectiverelative to outperform the share performance of other U.S.-based companies with similar market capitalization. The service requirement provides that PSUs cliff vest after atwo-year or three-year period (concurrent with the performance period), as defined by the award.20142015 PSU grants covering the performance period of 20142015 to 20152016 was at approximately the 33rd51st percentile on a blended basis relative to the Standard & Poor’s Midcap 400 index.and Russell 2000 indices. This resulted in no payoutan earnout of 86.5% of the 2014portion of 2015 PSU grants.grants based on atwo-year performance period.Performance RangeEarnout* 35th Percentile PerformanceEarnout *Threshold35th Percentile35% of Target 55th Percentile 100% of Target 75th Percentile 150% of Target * With proration between these levels27* With proration between these levels RSUs are awards that are settled in shares but vest in thirds over a three-year period based on service. RSUs are intended to focus behaviors on improving long-term stock price performance on an absolute basis (as a complement to therelative-performance nature of PSUs), increase share ownership and strengthen retention of participants through a three-year vesting period.Grantees receive dividends on the full amount of RSUs granted, regardless of vesting, at the same rate as is payable on the Company’s common stock. Payment of accrued dividend equivalents on PSUs will be made upon attainment of the applicable performance goals and will be paid according to the number of actual shares earned.2015NEO Base Salary as of 12/31/15 2015 LTI GrantTarget Total Direct Compensation 12/31/15(Including BaseSalary)EstimatedCompetitiveMarketPercentileMr. Kuriyama $540,750 $695,000 $1,771,250 25th percentile*Mr. Benjamin $465,830 $450,000 $1,217,688 50th percentileMr. Ito $360,680 $400,000 $977,088 50th percentileMr. Chun $322,348 $250,000 $733,522 50th percentileMs. Ching $271,817 $250,000 $657,726 50th percentile* At Mr. Kuriyama’s request, his salary and incentive compensation awards were capped at levels below what would otherwise be earned through his actual performance and significantly below 50th percentile levels for CEOs of other U.S.-based companies of similar size to A&B.2016 Base Salary as of
12/31/16 2016 LTI
Grant Target Total Direct
Compensation
12/31/16
(Including Base
Salary) Estimated
Competitive
Market
Percentile $ 618,000 $ 900,000 $ 2,136,000 25th percentile* $ 371,500 $ 400,000 $ 994,400 40th percentile $ 332,018 $ 275,000 $ 773,027 50th percentile $ 279,972 $ 275,000 $ 694,958 50th percentile $ 309,000 $ 200,000 $ 694,400 40th percentile * As 2016 was Mr. Benjamin’s first year as CEO, the Committee set his target total direct compensation to be below the market 50th percentile. As Mr. Benjamin’s tenure increases, his target total direct compensation is expected to move toward the Company’s compensation philosophy of targeting the 50th percentile for total compensation. Plans: Plans:The Company provides various retirement plans to assist its employees with retirement income savings and to attract and retain its employees. The Committee periodically reviews the value of benefits from the retirement plans in conjunction with all other forms of pay in making compensation decisions.Plan: Plan:The Company has atax-qualified defined contribution retirement plan (the “A&B Profit Sharing Retirement Plan”) available to all salariednon-bargaining unit employees that provides for performance-based discretionary contributions to participants based on the degree of achievement ofpre-tax income goal specific to the profit sharing plan as established in A&B’s 2015 operating plan.determined by the Compensation Committee. In 2015,2016, available contributions were set between zero and five percent of each employee’s base salary. There was no profit-sharing contribution for 2015 based on the Company’s below-threshold performance, in which Agribusiness losses negatively impacted overall strong performance by the rest of the Company.2016. The plan also provides a discretionary match under the Individual Deferred Compensation (401(k)) component of the plan for all salariednon-bargaining unit employees. In 2015,2016, that plan provided for a match of up to three percent of the compensation deferred by a participant during the fiscal year,28subject to IRS maximum compensation limitations. The value of the Company’s 20152016 profit sharing contribution and Individual Deferred Compensation matches for NEOs are included in the Summary Compensation Table of this Proxy Statement.PlanPlan:Thisnon-qualified: This non-qualified benefit plan (the “Excess Benefits Plan”) for executives is designed to meet the retirement plan objectives described above. All NEOs are eligible to participate in the Excess Benefits Plan. It complements the Qualified Retirement Plan and A&B Profit Sharing Retirement Plan by providing benefits and contributions in amounts that could not be provided by those plan’s formulas due to the limits imposed by tax law. The pension benefits under the Excess Benefits Plan that had accumulated as of December 31, 2011 pursuant to the traditional defined benefit formula were frozen and a cash balance formula was implemented for eligible employees beginning January 1, 2012. The Pension Benefits table of this Proxy Statement provides further information regarding the A&B Excess Benefits Plan.Perquisites: Perquisites:The Company has no NEO perquisites, with the exception of Company-provided parking in its headquarters building, which is provided at no additional cost to A&B.Towers Watson,WTW, uses data from five national and highly recognized published surveys representing a broad group of general industry and real estate companies similar in size to the Company to assess the Company’s pay practices. Towers WatsonWTW uses data subsets in each survey that represent companies of similar size with revenues between $250 million and $1 billion. The survey sources provide only one of the tools that the Committee uses to assess appropriate pay levels. Internal equity, Company performance, business unit performance, compensation philosophy, performance consistency, historical pay movement, pay mix, pay risk, economic environment and individual performance are also reviewed.29Towers WatsonWTW in its assessment of total direct compensation and CEO pay ratio as compared to other NEOs include:Towers Watson 2015WTW 2016 CDB General Industry Executive DatabaseTowers Watson 2015WTW 2016 CSR Top Management Compensation SurveyTowers Watson 2015WTW 2016 Long-term Incentives, Policies and Practices SurveyMercer 20152016 U.S. Benchmark Database - Executive Compensation SurveyNational Association for Real Estate Investment Trust (NAREIT) 20152016 Compensation SurveyTowers Watson,WTW, an independent executive compensation consulting firm, to assist the Committee in:Evaluating salary and incentive compensation levelsReviewing and suggesting executive pay plan design modificationsUnderstanding current trends and legislative reform initiatives in the area of executive compensationAssessing appropriate outside Board of Director pay levels and structuringTowers WatsonWTW engagements, including the nature, scope and fees of assignments.Towers Watson,WTW, the Compensation Committee considered, among other factors, the following:Depth and breadth of executive compensation knowledge and experienceQualifications as a board-level consultantQuality of resources available (staff, data, etc.)Understanding of A&B’s business strategy and issues, industry, performance drivers and human capital considerationsObjectivity in advice and recommendationsWillingness to provide candid feedback regarding management and Committee proposals, questions and concernsAccessibility and availabilityReporting relationship with the CommitteeWorking relationship with management and its human resources staffEffectiveness of communicationTowers WatsonThe individuals providing consulting services to the Committee are not personally involved in other services Towers WatsonWTW may provide to the CompanyThe individuals providing consulting services to the Committee are not directly compensated for the total revenues that Towers WatsonWTW generates from the CompanyTowers Watson’sWTW’s executive compensation consultants do not hold an equity stake in the CompanyOther services, if any, are provided under a separate contractual arrangementTowers Watson’sWTW’s executive compensation consultants do not serve as Towers Watson’sWTW’s client relationship manager on services provided to the Company30The Towers WatsonWTW executive compensation consultants have direct access to all members of the Committee during and between meetingsTowers WatsonWTW consultants are required to adhere to a stringent code of conduct articulating their commitment to impartial adviceamong others:Towers Watson'sWTW’s work, policies and procedures and determined that no conflicts of interest exist. In accordance with the New York Stock Exchange ("NYSE"(“NYSE”) requirements, the Compensation Committee annually assesses the independence of its compensation consultant, outside legal counsel, and other advisers who will provide services with respect to executive compensation matters. In assessing independence, the Compensation Committee considers the following factors, are considered:Whether a compensation adviser’s employer provides other services to A&BThe amount of fees the compensation adviser’s employer receives from A&B as a percentage of such employer’s total revenuesThe compensation adviser’s policies and procedures to prevent conflicts of interestBusiness or personal relationships between a compensation adviser and any member of A&B’s compensation committeeThe compensation adviser’s stock ownership in A&BBusiness or personal relationships between a compensation adviser or the compensation adviser’s employer and any executive officer of A&BProviding management’s perspective on compensation plan structure and implementationIdentifying appropriate performance measures and establishing company, unit and individual performance goals that are consistent with the Board-approved operating plansProviding the data used to measure performance against established goals, with the CEO providing perspective on individual executive performance and compensation amountsProviding recommendations, based on information provided by Towers Watson,WTW, regarding pay levels for officers on the basis of plan formulas, salary structures and the CEO’s assessment of individual officer performance31Salary Multiple 5X 3X 2015,2016, the members of the Compensation Committee were Mr. King, Chairman, Ms. Saito Mr. Doane (through April 28, 2015) and Ms. Wall (since April 28, 2015).Wall. As set forth above under the subsection “Certain Relationships and Transactions,” Ms. Wall is an executive officer in a corporation that is a tenant in fiveseveral properties owned by A&B32subsidiaries with leases established at market rates. Because of this related person transaction, Ms. Wall did not participate in any equity compensation decisions.The following table summarizes the compensation paid by A&B to its NEOs in 2016, 2015 2014 and 2013.20152014.Name and
Principal Position*Year Salary($) Bonus ($) (3) Stock Awards
($) (4)Option
Awards
($)Non-Equity
Incentive Plan
Compensa-tion
($) (5)Change in
Pension Value
and
Nonqualified
Deferred
Compensa-tion
Earnings
($) (6) All Other
Compensa-tion
($) (7)Total
($)(a) (b) (c) (d) (e) (f) (g) (h) (i) (j) Stanley M. Kuriyama 2,015 536,813 84,098 711,158 N/A 165,902 77,817 7,950 1,583,738 Charman of the 2,014 525,000 178,334 687,719 N/A 321,666 478,776 23,603 2,215,098 Board, and Chief 2,013 525,000 477,600 694,967 N/A 402,400 0 (8) 33,113 2,133,080 Executive Officer of A&B (1) Christopher J. 2,015 462,438 74,067 460,422 N/A 146,115 0 (9) 7,950 1,150,992 Benjamin 2,014 448,969 171,657 445,256 N/A 158,343 212,875 21,314 1,458,414 President and Chief 2,013 439,089 244,754 420,005 N/A 190,246 0 (9) 28,946 1,323,040 Operating Officer of A&B (2) Paul K. Ito 2,015 358,054 57,350 409,291 N/A 113,132 0 (10) 7,161 944,988 Senior Vice President, 2,014 338,756 102,399 395,827 N/A 122,601 101,802 17,997 1,079,382 Chief Financial 2,013 303,375 168,068 300,032 N/A 131,932 0 (10) 22,418 925,825 Officer, and Treasurer of A&B Nelson N. S. Chun 2,015 320,001 42,713 255,817 N/A 84,257 0 (11) 7,950 710,738 Senior Vice President, 2,014 310,680 78,690 247,383 N/A 91,310 133,234 17,151 878,448 Chief Legal Officer 2,013 302,722 126,264 194,981 N/A 98,736 0 (11) 22,299 745,002 of A&B Meredith J. Ching 2,015 254,156 36,017 255,817 N/A 71,049 0 (12) 7,625 624,664 Senior Vice President, 2,014 241,062 83,005 247,383 N/A 76,995 349,616 14,107 1,012,168 Government & 2,013 244,029 118,380 178,018 N/A 91,620 0 (12) 18,551 647,598 Community Relations, of A&B * As of December 31, 2015 Year
(b) Salary
($)
(c) Bonus
($) (1)
(d) Stock
Awards
($) (2)
(e) Option
Awards
($)
(f) Non-Equity
Incentive
Plan
Compensation
($) (3)
(g) Change in
Pension
Value
and
Nonqualified
Deferred
Compensation
Earnings
($) (4)
(h) All Other
Compensation
($) (5)
(i) Total
($)
(j) 2016 613,500 363,075 886,684 N/A 159,600 194,648 7,950 2,225,457 2016 368,795 130,955 394,049 N/A 57,565 55,892 7,813 1,015,069 2016 329,601 97,531 270,904 N/A 42,873 31,051 7,950 779,910 2016 253,229 82,242 270,904
255,817
247,383
N/A 36,152 176,230 7,597 826,354 2016 306,750 69,525 196,994 N/A 78,980 32,575 7,950 692,774 (1) Mr. Kuriyama was appointed Chairman of the Board and CEO of A&B on June 26, 2012 and retired as CEO on December 31, 2015.(2)Mr. Benjamin was appointed Chief Executive Officer of A&B, effective January 1, 2016. He was appointed President and Chief Operating Officer of A&B on June 26, 2012. He was appointed President of A&B Land Group and President of A & B Properties, Inc., from September 1, 2011 to September 1, 2015.(3)Represents the NEO’s award attributable to Value Creation and individual modifiers under the PIIP program for the fiscal year identified in column (b) payable in cash in February of the following year. 33(4)(2)Represents the grant-date fair value of time-based restricted stock units and the grant-date fair value of performance stock units for the fiscal year identified in column (b) granted in 2015 computed under ASC Topic 718. Performance stock units awarded in 20152016 vest in January 2017 and January 20182019 if performance goals are attained.attained at target. If maximum performance goals applicable to the performance stock units were to be achieved, the values in this column with respect to 2016 would be as follows: Mr. Benjamin, $1,105,027; Mr. Ito, $491,082; Mr. Chun, $337,613; Ms. Ching, $337,613; and Mr. Parker, $245,503. See Note 13 of the consolidated financial statements of the Company’s 20152016 Annual Report on Form10-K regarding the assumptions underlying the valuation of equity awards.(5)(3)Represents the NEO’s award attributable to financial goals under the PIIP program for the fiscal year identified in column (b) payable in cash in JanuaryFebruary of the following year.(6)(4)All amounts are attributable to the aggregate change in the actuarial present value of the NEO’s accumulated benefit under all defined benefit and actuarial pension plans. (7)(5)Represents amounts contributed by A&B to the NEO’s account under the A&B Individual Deferred Compensation and Profit Sharing Plan and Alexander & Baldwin, Inc. Excess Benefits Plan. (8) The change in pension value was a decrease of $101,681.(9) The change in pension value in 2015 was a decrease of $52,963 and in 2013 was a decrease of $106,179.(10) The change in pension value in 2015 was a decrease of $14,637 and in 2013 was a decrease of $26,583.(11) The change in pension value in 2015 was a decrease of $26,890 and in 2013 was a decrease of $11,281.(12) The change in pension value in 2015 was a decrease of $15,432 and in 2013 was a decrease of $98,164.(6) The change in pension value was a decrease of $52,963. (7) The change in pension value was a decrease of $14,637. (8) The change in pension value was a decrease of $26,890.
The following table contains information concerning thenon-equity and equity grants under A&B’s incentive plans during (9) The change in pension value was a decrease of $15,432. 20152016 to the NEOs.2015Name GrantDateEstimated Future PayoutsUnder Non-Equity IncentivePlan Awards (1)Estimated Future PayoutsUnder Equity Incentive PlanAwards (2)AllOtherStockAwards:NumberofSharesof Stockor Units(#) (3)All OtherOptionAwards:Number ofSecuritiesUnderlyingOptions(#) (4)Exerciseor BasePrice ofOptionAwards($/Sh)GrantDate FairValue ofStockandOptionAwards($) (5)Threshold($)Target($)Maximum($)Threshold(#)Target(#)Maximum(#)(a) (b) (c) (d) (e) (f) (g) (h) (i) (j) (k) (l) Stanley M. Kuriyama 1/26/15 187,370 374,740 749,480 3,038 8,679 13,019 8,679 N/A N/A 711,158 Christopher J. Benjamin 1/26/15 92,235 184,469 368,938 1,967 5,619 8,429 5,619 N/A N/A 460,422 Paul K. Ito 1/26/15 71,415 142,829 285,658 1,748 4,995 7,493 4,995 N/A N/A 409,291 Nelson N. S. Chun 1/26/15 53,188 106,375 212,750 1,093 3,122 4,683 3,122 N/A N/A 255,817 Meredith J. Ching 1/26/15 44,850 89,700 179,400 1,093 3,122 4,683 3,122 N/A N/A 255,817 Exercise or
Base Price
of Option
Awards
($/Sh) Estimated Future Payouts Under Non-Equity Incentive Plan Estimated Future Payouts Under Shares of Securities of Stock Awards (1) Equity Incentive Plan Awards (2) Stock or Underlying and Option Grant Threshold Target Maximum Threshold Target Maximum Units Options Awards Date ($) ($) ($) (#) (#) (#) (#) (3) (#) (4) ($) (5) (a) (b) (c) (d) (e) (f) (g) (h) (i) (j) (k) (l) 1/25/16 173,813 347,625 695,250 5,207 14,876 22,314 14,876 N/A N/A 886,684 1/25/16 62,692 125,383 250,766 2,314 6,611 9,917 6,611 N/A N/A 394,049 1/25/16 46,691 93,381 186,762 1,591 4,545 6,818 4,545 N/A N/A 270,904 1/25/16 39,372 78,744 157,488 1,591 4,545 6,818 4,545 N/A N/A 270,904 1/25/16 64,890 129,780 259,560 1,157 3,305 4,958 3,305 N/A N/A 196,994 (1) Amounts reflected in this section relate to estimated payouts under thenon-equity incentive portion of the PIIP. The value of the actual payouts is included in column (g) of the Summary Compensation Table. (2) Amounts in this section reflect performance share unit grants. Performance share units awarded in 20152016 vest in January 2017 and 20182019 if performance goals are attained during the performance period.(3) Amounts in this section reflect time-based restricted stock unit grants awarded. (4) No options were granted in 2015.2016.(5) Represents the grant-date fair value of the equity awards granted in 20152016 computed under ASC Topic 718. See Note 13 of the consolidated financial statements of the Company’s 20152016 Annual Report on Form10-K regarding the assumptions underlying the valuation of equity awards.corporatefinancial, operating, and businessvalue creation goals, depending on the executive’s job responsibilities and individual performance. Performance measures, weighting of goals and target opportunities are discussed in the CD&A section of this Proxy Statement. Information on equity grants is provided in the CD&A section of this Proxy Statement. Year-EndYear-End.. The following table contains information concerning the outstanding equity awards held by the NEOs.342015 Options Awards Stock Awards Name Number of Securities Underlying Unexercised Options
(#)
ExercisableNumber of Securities Underlying Unexercised Options
(#)
UnexercisableEquity Incentive Plan Awards: Number of Securities Underlying Unexercised Unearned Options
(#)Option Exercise Price
($)Option Expiration Date Number of Shares or Units of Stock that Have Not Vested
(#)Market Value of Shares or Units of Stock that Have Not Vested ($)(6) Equity Incentive Plan Awards: Number of Unearned Shares, Units or Other Rights that Have Not Vested (#) Equity Incentive Plan Awards: Market or Payout Value of Unearned Shares, Units or Other Rights that Have Not Vested ($)(6) (a) (b) (c) (d) (e) (f) (g) (h) (i) (j) Stanley M. Kuriyama 25,865 — 25.59 1/24/2016 17,951 (1) 633,850 17,347 612,523 39,810 — 23.48 1/23/2017 69,447 — 22.11 1/29/2018 117,828 — 11.37 1/27/2019 169,813 — 16.09 1/26/2020 69,041 — 19.80 1/25/2021 51,608 22.54 1/24/2022 Christopher J. Benjamin 3,933 — 22.11 1/29/2018 11,472 (2) 405,076 11,231 396,567 25,000 — 11.37 1/27/2019 49,105 — 16.09 1/26/2020 34,877 — 19.80 1/25/2021 33,545 22.54 1/24/2022 Paul K. Ito 2,258 — 25.59 1/24/2016 9,829 (3) 347,062 9,984 352,535 3,695 — 20.58 6/20/2016 6,634 — 23.48 1/23/2017 13,021 — 22.11 1/29/2018 6,546 — 11.37 1/27/2019 22,640 — 16.09 1/26/2020 15,533 — 19.80 1/25/2021 11,610 22.54 1/24/2022 Nelson N. S. Chun 8,621 — 25.59 1/24/2016 6,181 (4) 218,251 6,240 220,334 15,923 — 23.48 1/23/2017 26,042 — 22.11 1/29/2018 9,434 — 16.09 1/26/2020 20,713 19.80 1/25/2021 15,482 — 22.54 1/24/2022 Meredith J. Ching 6,569 — 25.59 1/24/2016 6,081 (5) 214,720 6,240 220,334 7,962 — 23.48 1/23/2017 13,021 — 22.11 1/29/2018 16,365 — 11.37 1/27/2019 19,811 — 16.09 1/26/2020 15,533 — 19.80 1/25/2021 11,610 22.54 1/24/2022 (1) Vesting date of unrestricted stock - 3,493 shares on 1/28/16; 2,889 shares on 1/27/16; 2,980 shares on 1/27/17; 2,893 shares each on 1/26/16, 1/26/17 and 1/26/18.35 Option Awards Stock Awards Equity Incentive Plan Equity Incentive Awards: Plan Market or Equity Awards: Payout Incentive Number of Value of Plan Awards: Market Unearned Unearned Number of Number of Number of Number Value of Shares, Shares, Securities Securities Securities of Shares Shares or Units or Units or Underlying Underlying Underlying or Units of Units of Other Other Unexercised Unexercised Unexercised Option Stock that Stock that Rights that Rights that Options Options Unearned Exercise Option Have Not Have Not Have Not Have Not (#) (#) Options Price Expiration Vested Vested Vested Vested Exercisable Unexercisable (#) ($) Date (#) ($)(6) (#) ($)(6) (a) (b) (c) (d) (e) (f) (g) (h) (i) (j) 3,933 — — 22.11 1/29/2018 20,493 (1) 919,521 7,172 (7) 321,808 25,000 — — 11.37 1/27/2019 49,105 — — 16.09 1/26/2020 34,877 — — 19.80 1/25/2021 33,545 — — 22.54 1/24/2022 13,021 — — 22.11 1/29/2018 11,604 (2) 520,671 4,060 (8) 182,172 6,546 — — 11.37 1/27/2019 22,640 — — 16.09 1/26/2020 15,533 — — 19.80 1/25/2021 11,610 — — 22.54 1/24/2022 21,042 — — 22.11 1/29/2018 7,667 (3) 344,018 2,682 (9) 120,341 9,434 — — 16.09 1/26/2020 20,713 — — 19.80 1/25/2021 15,482 — — 22.54 1/24/2022 13,021 — — 22.11 1/29/2018 7,667 (4) 344,018 2,682 (9) 120,341 16,365 — — 11.37 1/27/2019 19,811 — — 16.09 1/26/2020 15,533 — — 19.80 1/25/2021 11,610 — — 22.54 1/24/2022 1,152 — — 19.80 1/25/2021 4,304 (5) 193,120 1,505 (10) 67,529 (1) Vesting date of unrestricted stock –1,871 shares on 1/27/17; 1,873 shares each on 1/26/17 and 1/26/18; 4,958 shares on 1/25/17 and 4,959 shares each on 1/25/18 and 1/25/19. (2) Vesting date of unrestricted stock -2,111- 1,663 shares on 1/28/16; 1,87127/17; 1,665 shares each on 1/27/1626/17 and 1/27/17; 1,87326/18; 2,203 shares on 1/25/17 and 2,204 shares each on 1/26/16, 1/26/1725/18 and 1/26/18.25/19.(3) Vesting date of unrestricted stock - 1,5081,040 shares on 1/27/17; 1,041 shares each on 1/28/16; 1,66326/17 and 1/26/18; 1,515 shares each on 1/27/1625/17, 1/25/18, and 1/27/17; 1,665 shares each on 1/26/16, 1/26/17 and 1/26/18.25/19.(4) Vesting date of unrestricted stock - 980 shares on 1/28/16; 1,039 shares on 1/27/16 and 1,040 shares on 1/27/17; 1,040 shares on 1/26/16 and 1,041 shares each on 1/26/17 and 1/26/18.18; 1,515 shares each on 1/25/17, 1/25/18, and 1/25/19.(5) Vesting date of unrestricted stock - 880 shares on 1/28/16; 1,039 shares on 1/27/16 and 1,040– 333 shares on 1/27/17; 1,040 shares on 1/26/16 and 1,041333 shares each on 1/26/17 and 1/26/18.18; 1,101 shares on 1/25/17 and 1,102 shares each on 1/25/18 and 1/25/19.(6) Market value of stock not vested based on the closing stock price atyear-end of $35.31.$44.87.(7) Vesting date of PSUs – 983 shares each on 1/26/17 and 1/26/18; and 5,206 shares on 1/25/19. (8) Vesting date of PSUs – 873 shares on 1/26/17; 874 shares on 8/16/18; and 2,313 shares on 1/25/19. (9) Vesting date of PSUs – 546 shares each on 1/26/17 and 1/26/18; and 1,590 shares on 1/25/19. (10) Vesting date of PSUs – 174 shares on 1/26/17; 175 shares on 1/26/18; and 1,156 shares on 1/25/19. Option Exercises and Stock Vested.The following table contains information concerning option exercises and the vesting of stock awards for the NEOs during 2015.2016.2015Name OPTION AWARDS STOCK AWARDS Number of SharesAcquired onExercise(#)Value Realizedon Exercise($)Number of SharesAcquired onVesting(#)Value Realizedon Vesting($)(a) (b) (c) (d) (e) Stanley M. Kuriyama - - 15,439 599,471 Christopher J. Benjamin - - 9,637 374,352 Paul K. Ito - - 6,256 242,722 Nelson N. S. Chun - - 4,637 180,216 Meredith J. Ching - - 4,093 159,045 2016 OPTION AWARDS STOCK AWARDS Number of Shares Number of Shares Acquired on Value Realized Acquired on Value Realized Exercise on Exercise Vesting on Vesting Name (#) ($) (#) ($) (b) (c) (d) (e) — — 5,855 177,916 12,587 197,141 4,836 147,094 29,544 428,703 3,059 93,028 14,531 189,153 2,959 90,028 — — 943 28,693 36The following table contains information concerning pension benefits for the NEOs at the end of 2015.2016.2015Name Plan Name Number of Years Credited Service
(#)Present Value of Accumulated Benefit
($)Payments During Last Fiscal Year
($)(a) (b) (c) (d) (e) Stanley M. Kuriyama A&B Retirement Plan for Salaried Employees 24.0 1,168,888 -- A&B Excess Benefits Plan 24.0 3,457,636 -- Christopher J. Benjamin A&B Retirement Plan for Salaried Employees 14.4 429,543 -- A&B Excess Benefits Plan 14.4 978,250 -- Paul K. Ito A&B Retirement Plan for Salaried Employees 10.8 222,856 -- A&B Excess Benefits Plan 10.8 119,927 -- Nelson N. S. Chun A&B Retirement Plan for Salaried Employees 12.2 499,415 -- A&B Excess Benefits Plan 12.2 582,676 -- Meredith J. Ching A&B Retirement Plan for Salaried Employees 33.6 1,495,830 -- A&B Excess Benefits Plan 33.6 510,339 -- 2016Present Number of Value of Payments Years Credited Accumulated During Last Service (1) Benefit Fiscal Year (#) ($) ($) (a) (b) (c) (d) (e) 15.4
15.4476,953
1,125,488—
— 11.8
11.8253,554
145,121—
— 13.2
13.2509,390
603,752—
— 34.6
34.61,614,682
567,717—
— 12.3
12.3190,941
16,684—
— 1 Credited service used to calculate the traditional defined benefit was frozen as of December 31, 2011; years shown are based on all years under the plan. 4.50%4.20% and 3.9%3.50%, respectively. Age 62 with 5 years of service (or current age, if greater) is the assumed retirement age. Qualified plan benefits (traditional defined benefit and cash balance) are assumed to be paid on a life annuity basis (however, cash balance portion could be paid in a lump sum). The cash balance accounts are projected to the assumed retirement age using 2.14%1.65% interest per year (the rate in effect for 2016)2017) with no future pay credits. The projected qualified plan cash balance accounts were converted to life annuities at the assumed retirement age using the annuity conversion interest assumptions and mortality used in our financial disclosures, i.e., 1.69%1.47% (for the first 5 years), 4.11%3.34% (next 15 years) and 5.07%4.3% (years in excess of 20) applied on a rolling basis, and the Applicable Mortality Table, as defined for lump sum calculations under Section 417(e) of the Internal Revenue Code.1.03%0.9% (for the first 5 years), 2.51%2.04% (next 15 years) and 3.09%2.62% (years in excess of 20) applied on a rolling basis, and the Applicable Mortality Table, as defined for lump sum calculations under Section 417(e) of the Internal Revenue Code. The cash balance accounts are projected to the assumed retirement age using 2.14%1.65% interest per year (the rate in effect for 2016)2017) with no future pay credits.compensa-37tioncompensation in the five highest consecutive years of their final 10 years of service through December 31, 2011. Compensation included base salary, overtime pay andone-year bonuses. The amounts were expressed as a single life annuity payable at the normal retirement age of 65. An employee became vested after five years of service with A&B Predecessor or the Company. An employee may take early retirement at age 55 or older, if the employee has already completed at least five years of service with A&B Predecessor or the Company. If an employee retires early, the same formula for normal retirement is used, although the benefit will be reduced for commencement before age 62 because the employee will receive payment early and over a longer period of time.Plan: Plan:The A&B Excess Benefits Plan is discussed in the CD&A section of this Proxy Statement. Under the pension portion of the Excess Benefits Plan associated with the Qualified Retirement Plan, benefits under the traditional defined benefit formula are payable after the executive’s separation from service in a lump sum that is actuarially equivalent to the annuity form of payment, and the cash balance account is paid as a lump sum. Under the profit sharing portion of the Excess Benefits Plan associated with the A&B Profit Sharing Retirement Plan, amounts are credited to executives’ accounts, to be payable after the executive’s separation from service. All NEOs are eligible to participate in the Excess Benefits Plan. DEFERRED COMPENSATION2015 NON-QUALIFIED DEFERRED COMPENSATION Name Executive Contributions in Last FY($)Registrant Contributions in Last FY
($)(1)Aggregate Earnings in Last FY
($)(2)Aggregate Withdrawals/ Distributions
($)Aggregate Balance at Last FYE
($)(a) (b) (c) (d) (e) (f) Stanley M. Kuriyama -- 7,977 1,339 -- 76,248 Christopher J. Benjamin -- 5,688 344 -- 23,220 Paul K. Ito -- 2,371 -- -- 4,771 Nelson N. S. Chun -- 1,525 165 -- 9,932 Meredith J. Ching -- -- -- -- -- Executive Registrant Aggregate Aggregate Aggregate Contributions in Contributions in Earnings in Last Withdrawals/ Balance at Last Last FY Last FY FY Distributions FYE ($) ($)(1) ($)(2) ($) ($) (a) (b) (c) (d) (e) (f) — — 522 — 23,742 — — 108 — 4,928 — — 223 — 10,155 — — — — — — — — — — (1) Represents the profit sharing benefit under the Excess Benefits Plan. (2) Represents interest earned on the prior year'syear’s cash account balance.Payments.Agreements: Agreements:A&B has entered into Change in Control Agreements with each of the NEOs, which are intended to encourage their continued employment with A&B by providing them with greater security in the event of termination of their employment following a change in control of A&B. The Company has adopted a participation policy that extends these agreements to those senior level executives whose employment would be most likely at risk upon a change in control. Each Change in Control Agreement has an initialone-year term and is automatically extended at the end of each term for a successiveone-year period, unless terminated by A&B. The Change in Control Agreements38provide for certain severance benefits if the executive’s employment is terminated by A&B without “cause” or by the executive for “good reason,” in each case as defined in the agreement, following a “Change in Control Event” of A&B, as defined by Internal Revenue Code Section 409A, as follows: Upon a termination of employment under the above circumstances, the executive will be entitled to receive (i) alump-sum severance payment equal to two times the sum of the executive’s base salary and target bonus, (ii) pro rata payment at target with respect to outstanding contingent awards for uncompleted performance periods, (iii) a lump sum payment of amounts due the executive under deferred compensation plans, and (iv) an amount equal to the positive spread between the exercise price of outstanding options held by the executive and the fair market value of the underlying shares at the time of termination. In addition, A&B will maintain all (or provide similar) health and welfare benefit plans for the executive’s continued benefit for a period of two years after termination. A&B will also reimburse executives for individual outplacement counseling services up to $10,000. These are “double trigger” agreements under which no payments are made and long-term incentives do not accelerate unless both a change in control and a qualifying termination of employment occurs.Resignation:Resignation:If the executive voluntarily resigns from the Company, no amounts are payable under the Severance Plan or the PIIP. The executive may be entitled to receive retirement and retiree health and welfare benefits to the extent those benefits have been earned or vested under the provisions of the plans. The executive may have up to three to six months after termination to exercise vested stock options at the time of termination. In addition, the executive would be entitled to any amounts voluntarily deferred (and the earnings accrued) under the A&B Profit Sharing Retirement Plan.392015.2016.Stanley M. Kuriyama (9)Components Change in Control w/ Termination ($) Termination w/o cause ($)(1) Termination w/ cause ($) Voluntary Resignation ($) Death ($) Disability ($)(3) Retirement ($)(2) Cash Severance 2,217,075 540,750 — — — — — Retirement Benefits (4)16,517 — — — — — — — — — — (521,108 ) (5)(6) — — Health & Welfare Benefits 39,535 17,164 — — — — — Outplacement Counseling 10,000 10,000 — — — — — Long-Term Incentives (7)949,657 — — — 768,154 768,154 (8) 768,154 (8) Total (lump sum) 3,232,784 567,914 — — 768,154 768,154 768,154 Total (annuity) — — — — (521,108 ) (6) — — Christopher J. Benjamin Components Change in Control w/ Termination ($) Termination w/o cause ($)(1) Termination w/ cause ($) Voluntary Resignation ($) Death ($) Disability ($)(3) Retirement ($)(2) Cash Severance 1,490,656 465,830 — — — — — Retirement Benefits (4)162,483 (153,139 ) (6) (153,139 ) (6) (153,139 ) (6) (153,139 ) (6) — — (70,548 ) (5)(6) (70,548 ) (5)(6) (70,548 ) (5)(6) (70,548 ) (5)(6) (238,541 ) (5)(6) — Not yet eligible Health & Welfare Benefits 39,084 17,115 — — — — — Outplacement Counseling 10,000 10,000 — — — — — Long-Term Incentives (7)609,390 — — — 491,904 491,904 (8) Not yet eligible Total (lump sum) 2,311,613 339,806 (153,139 ) (6) (153,139 ) (6) 338,765 491,904 — Total (annuity) (6)(70,548 ) (70,548 ) (70,548 ) (70,548 ) (238,541 ) — Not yet eligible Paul K. Ito Components Change in Control w/ Termination ($) Termination w/o cause ($)(1) Termination w/ cause ($) Voluntary Resignation ($) Death ($) Disability ($)(3) Retirement ($)(2) Cash Severance 1,154,176 360,680 — — — — — Retirement Benefits (4)74,618 (898 ) (6) (898 ) (6) (898 ) (6) (898 ) (6) — — (34,545 ) (5)(6) (34,545 ) (5)(6) (34,545 ) (5)(6) (34,545 ) (5)(6) (108,427 ) (5)(6) — Not yet eligible Health & Welfare Benefits 32,727 14,483 — — — — — Outplacement Counseling 10,000 10,000 — — — — — Long-Term Incentives (7)528,444 — — — 423,983 423,983 (8) Not yet eligible Total (lump sum) 1,799,965 384,265 (898 ) (6) (898 ) (6) 423,085 423,983 — Total (annuity) (6)(34,545 ) (34,545 ) (34,545 ) (34,545 ) (108,427 ) — Not yet eligible 40Nelson N. S. Chun (9)Components Change in Control w/ Termination ($) Termination w/o cause ($)(1) Termination w/ cause ($) Voluntary Resignation ($) Death ($) Disability ($)(3) Retirement ($)(2) Cash Severance 967,044 322,348 — — — — — Retirement Benefits (4)2,678 — — — (204,171 ) (5)(6) — — — — — — — — — Health & Welfare Benefits 27,354 11,997 — — — — — Outplacement Counseling 10,000 10,000 — — — — — Long-Term Incentives (7)331,647 — — — 266,358 266,358 (8) 266,358 (8) Total (lump sum) 1,338,723 344,345 — — 266,358 266,358 — Total (annuity) (6)— — — — (204,171 ) (6) — — Meredith J. ChingComponents Change in Control w/ Termination ($) Termination w/o cause ($)(1) Termination w/ cause ($) Voluntary Resignation ($) Death ($) Disability ($)(3) Retirement ($)(2) Cash Severance 815,451 271,817 — — — — — Retirement Benefits (4)43,920 41,143 41,143 41,143 41,143 — 41,143 91,792 (5) 91,792 (5) 91,792 (5) 91,792 (5) (783,412 ) (5)(6) — 91,792 (5) Health & Welfare Benefits 24,593 10,879 — — — — — Outplacement Counseling 10,000 10,000 — — — — — Long-Term Incentives (7)328,042 — — — 262,753 262,753 (8) 262,753 (8) Total (lump sum) 1,222,006 333,839 41,143 41,143 303,896 262,753 303,896 Total (annuity) (6)91,792 91,792 91,792 91,792 (783,412 ) (6) — 91,792 Christopher J. Benjamin Change in
Control w/
Termination ($) Termination
w/o cause
($)(1) Termination
w/ cause ($) Voluntary
Resignation
($) Death ($) Disability
($)(2) Retirement
($)(3) 2,472,000 618,000 — — — — — 73,201 (194,324 )(6) (194,324 )(6) (194,324 )(6) (194,324 )(6) — Not yet eligible (75,859 )(5)(6) (75,859 )(5)(6) (75,859 )(5)(6) (75,859 )(5)(6) (262,475 )(5)(6) — Not yet eligible 42,783 18,476 — — — — — 10,000 10,000 — — — — — 1,727,185 — — — 1,232,664 1,232,664 Not yet eligible 4,325,170 452,152 (194,324 )(6) (194,324 )(6) 1,038,340 1,232,664 — (75,859 )(6) (75,859 )(6) (75,859 )(6) (75,859 )(6) (262,475 )(6) — Not yet eligible Paul K. Ito Change in Termination Voluntary Control w/ w/o cause Termination w/ Resignation Disability Retirement Termination ($) ($)(1) cause ($) ($) Death ($) ($)(2) ($)(3) 1,188,800 371,500 — — — — — 68,010 (1,008 )(6) (1,008 )(6) (1,008 )(6) (1,008 )(6) — Not yet eligible (38,159 )(5)(6) (38,159 )(5)(6) (38,159 )(5)(6) (38,159 )(5)(6) (122,022 )(5)(6) — Not yet eligible 34,345 15,002 — — — — — 10,000 10,000 — — — — — 937,827 — — — 698,506 698,506 Not yet eligible 2,238,983 395,494 (1,008 )(6) (1,008 )(6) 697,498 698,506 — (38,159 )(6) (38,159 )(6) (38,159 )(6) (38,159 )(6) (122,022 )(6) — Not yet eligible Nelson N. S. Chun (8) Change in Termination Voluntary Control w/ w/o cause Termination w/ Resignation Disability Retirement Termination ($) ($)(1) cause ($) ($) Death ($) ($)(2) ($)(3) 996,054 322,018 — — — — — (25,973 ) — — — — — — — — — — (202,027 )(6) — — 29,427 12,774 — — — — — 10,000 10,000 — — — — — 623,525 — — — 461,440 461,440 461,440 1,633,034 354,792 — — 461,440 461,440 461,440 — — — — (202,027 )(6) — — Meredith J. Ching Change in Termination Voluntary Control w/ w/o cause Termination w/ Resignation Disability Retirement Termination ($) ($)(1) cause ($) ($) Death ($) ($)(2) ($)(3) 839,916 279,972 — — — — — (83 )(6) 29,221 29,221 29,221 29,221 — 29,221 68,115 (5) 68,115 (5) 68,115 (5) 68,115 (5) (898,638 )(5)(6) — 68,115 (5) 26,473 11,604 — — — — — 10,000 10,000 — — — — — 623,480 — — — 461,395 461,395 461,395 1,499,787 330,797 29,221 29,221 490,616 461,395 490,616 68,115 68,115 68,115 68,115 (898,638 )(6) — 68,115 Lance K. Parker Change in
Control w/
Termination ($) Termination
w/o cause
($)(1) Termination w/
cause ($) Voluntary
Resignation
($) Death ($) Disability
($)(2) Retirement
($)(3) 828,363 309,000 — — — — — 47,981 6,749 6,749 6,749 6,749 — Not yet eligible (28,121 )(5)(6) (28,121 )(5)(6) (28,121 )(5)(6) (28,121 )(5)(6) (89,233 )(5)(6) — Not yet eligible 17,830 7,083 — — — — — 10,000 10,000 — — — — — 366,778 — — — 258,851 258,851 258,851 1,270,951 332,832 6,749 6,749 265,600 258,851 258,851 (28,121 )(6) (28,121 )(6) (28,121 )(6) (28,121 )(6) (89,233 )(6) — Not yet eligible (1) Assumes execution of an acceptable release agreement as provided by the Executive Severance Plan. (2) Normal retirement is at age 65. An executive with 5 years of service may retire at age 62 with unreduced traditional defined benefit pension benefits under the Qualified Retirement Plans. Employees may elect early reirement after attaining age 55 and completing 5 years of service.(3)If an NEO is disabled, hethe executive will continue to accrue credited vesting service as long as hehe/she is continuously receiving disability benefits under A&B’s sickness benefits plan or long-term disability benefit plan. Should the NEO stop receiving disability benefits, the accrual of credited vesting service will cease. Upon the later of attainment of age 65 or the date at which hethe executive is no longer eligible for disability benefits, the NEO will be entitled to receive a pension benefit based on his years of credited benefit service and his compensation prior to his becoming disabled.(3) Normal retirement is at age 65. An executive with 5 years of service may retire at age 62 with unreduced traditional defined benefit pension benefits under the Qualified Retirement Plans. Employees may elect early retirement after attaining age 55 and completing 5 years of service. (4) Retirement Benefits figures are incremental to the values shown in the Pension Benefits Table, which uses a different set of assumptions as described in the related narrative. (5) Represents the present value of amount paid as an annuity. (6) The Retirement Benefits figures are incremental to the values shown in the Pension Benefits Table. Under certain termination scenarios, benefits reflected in the Pension Benefits Table under the various retirement plans are forfeited or reduced resulting in a negative value. (7) Includes the gain on accelerated stock options and the value of accelerated restricted stock and performance share units. The value of stock awards was determined based on the closing price of A&B common stock on December 31, 20152016 of $35.31.41(8)An NEO receives continued three-year vesting of stock options; see Outstanding Equity Awards at Fiscal Year-End table in this Proxy Statement for vested and unvested equity awards.$44.87.(9)(8)Mr. Chun and Mr. Kuriyama turned 62 duringin 2014 and 2015, respectively, and became eligible for unreduced retirement benefits per the Company’s retirement plan. Therefore, Mr. Chun’s and Mr. Kuriyama’s benefits upon termination are the same as those shown in the pension benefits table (figures shown in the executive termination table are incremental to those in the pension benefits table). Mr. Chun’s and Mr. Kuriyama’s qualified pension death benefits are different upon death since the death benefits are payable to their spouseshis spouse assuming Joint & Survivor 50% form of payment is elected (non-qualified(non-qualified death benefits are the same as retirement since they are payable as lump sums, as if Mr. Chun and Mr. Kuriyama retireretires as of 1/1/2016)2017). Thenon-qualified Change in Control (“CIC”) benefits are different as they are calculated based on lump sum assumptions as of the assumed CIC date (as of 12/31/2015)2016).forward-lookingforward- looking statement.Leasing operating profit from continuing operations, less general, administrative and administrativeother expenses, straight-line rental adjustments, interest income, interest expense, and depreciation and amortization, and gains on sales of interests in real estate.amortization. NOI is considered by management to be an important and appropriate supplemental performance metric because management believes it helps both investors and management understand the ongoing core operations of our properties excluding corporate and financing-related costs and noncash depreciation and amortization. NOI is an unlevered operating performance metric of our properties and allows for a useful comparison of the operating performance of individual assets or groups of assets. This measure thereby provides an operating perspective not immediately apparent from GAAP income (loss) from operations or net income (loss). NOI should not be considered as an alternative to GAAP net income (loss) as an indicator of the Company'sCompany’s financial performance, or as an alternative to cash flow from operating activities as a measure of the Company'sCompany’s liquidity. Other real estate companies may use different methodologies for calculating NOI, and accordingly, the Company'sCompany’s presentation of NOI may not be comparable to other real estate companies. The Company believes that the Commercial Real Estate Leasing segment'ssegment’s operating profit from continuing operations is the most directly comparable GAAP measurement to NOI. A reconciliation of Commercial Real Estate Leasing segment operating profit to Commercial Real Estate Leasing segment NOI is as follows:42Real Estate LeasingCRE Operating Profit to NOI, Year Ended December 31, (In Millions) 2015 2014 Real Estate Leasing segment operating profit before discontinued operations $ 53.1 $ 47.5 Less amounts reported in discontinued operations (pre-tax) — (0.3 ) Real Estate Leasing segment operating profit from continuing operations 53.1 47.2 Adjustments: Depreciation and amortization 28.9 28.0 Straight-line lease adjustments (2.3 ) (2.7 ) General and administrative expenses and other 4.2 4.5 Discontinued operations — 0.3 Real Estate Leasing segment NOI $ 83.9 $ 77.3 Adjusted NOI, and Same-store Adjusted NOI Year Ended
December 31 (In Millions) 2016 2015 $ 54.8 $ 53.2 28.4 28.9 (2.1 ) (2.3 ) 5.3 4.2 $ 86.4 $ 84.0 Year Ended
December 31 (In Millions) 2016 2015 $ 86.4 $ 84.0 0.4 0.4 (0.4 ) (0.5 ) $ 86.4 $ 83.9 (11.2 ) (9.4 ) $ 75.2 $ 74.5 segment'ssegment’s EBITDA. A reconciliation of segment operating profit to EBITDA follows: Year Ended (In millions) December 31 2015 2014 Operating profit $ 30.9 $ 25.9 Depreciation & amortization expense 11.6 15.2 Income attributable to non-controlling interest (1.5 ) (3.1 ) EBITDA* $ 41.0 $ 38.0 Year Ended
December 31 (In Millions) 2016 2015 $ 23.3 $ 30.9 11.7 11.6 (1.8 ) (1.5 ) $ 33.2 $ 41.0 4 *InExcludes industrial lease income of approximately $400,000 for 2016, as such amounts are included within the secondCommercial Real Estate as a result of the segment changes during the fourth quarter of 2014, the Company discontinued reporting adjusted EBITDA as the impacts of purchase price allocation adjustments on EBITDA became de minimis. For the year ended December 31, 2014, the impact of purchase price allocation adjustments on EBITDA to derive adjusted EBITDA was a negative $0.2 million.2016.(In Millions) 2016 $ 35.3 10.9 9.8 9.5 1.8 $ 67.3 PROPOSAL NO. 2: ADVISORY VOTE ON EXECUTIVE COMPENSATIONobjectivesperformance and further shareholder interests through a compensation program that attracts, motivates and retains outstanding executives, and rewards outstanding performance. The CD&A section of this Proxy Statement, beginning on page 19,20, discusses our policies and procedures that implement our compensation philosophy. Highlights of our compensation program include the following:43Executive compensation is closely aligned with performance. In 2015,2016, between 56 and 70 percent of the NEOs’ target total direct compensation was variable and performance-based, with 70 percent of the CEO’s target total direct compensation variable and performance-based. The ratio of variable compensation is consistent with market practices.
The Company remains committed to responsible pay practices and has adopted policies that are representative of best practices, including a clawback policy that applies to all senior management and a policy prohibiting hedging and other speculative transactions involving Company stock. The Compensation Committee is focused on continuous improvement in executive compensation practices and policies to ensure alignment between pay and performance, as well as implementation of best practices. This includes, but is not limited to, such practices as adopting a 50th percentile target compensation philosophy, using multiple performance metrics and multi-year equity vesting, double triggers on equity grants in the event of a change in control, reasonablechange-in-control agreements, protocols for an annual pay risk assessment, meaningful stock ownership guidelines, and no employment agreements, guaranteed bonuses,gross-ups, stock option repricing or executive perquisites (other than parking). In 2016, the average total direct compensation for NEOs was slightly below the 50th percentile targeted.•The Company remains committed to responsible pay practices and has adopted policies that are representative of best practices, including a clawback policy that applies to all senior management and a policy prohibiting hedging and other speculative transactions involving Company stock. The Compensation Committee is focused on continuous improvement in executive compensation practices and policies to ensure alignment between pay and performance, as well as implementation of best practices. This includes, but is not limited to, such practices as adopting a 50th percentile target compensation philosophy, using multiple performance metrics and multi-year equity vesting, double triggers on equity grants in the event of a change in control, reasonable change-in-control agreements, protocols for an annual pay risk assessment, meaningful stock ownership guidelines, and no employment agreements, guaranteed bonuses, gross-ups, stock option repricing or executive perquisites (other than parking). In 2015, the average total direct compensation for NEOs was below the 50th percentile targeted.As described previously in this proxy statement,Proxy Statement, the Company with the exception of Agribusiness, performed well in 20152016, given the challenges of exiting sugar operations and conducting anin-depth evaluation of a REIT structure, and significant value creation accomplishments were achieved. The executive compensation program reflected between threshold and target performance by the Company in 2015, which resulted in payouts2016, ranging between 44%80% to 78.8%85% of annual cash incentive targetstarget for the NEOs. No profit sharing contribution was earned.
The actual performance level attained for the 2015 PSU grants covering the performance period of 2015 – 2016 was at approximately the 51st percentile on a blended basis relative to the Standard & Poor’s Midcap 400 and Russell 2000 indices, which resulted in an 86.5% earnout of the performance shares awarded with atwo-year performance horizon.•The actual performance level attained for the 2014 PSU grants covering the performance period of 2014 – 2015 was at the 33rd percentile relative to the Standard & Poor’s Midcap 400 index. This resulted in a payout of 0% of target.20162017 Annual Meeting of Shareholders pursuant to the compensation disclosure rules of the Securities and Exchange Commission, including the Compensation Discussion and Analysis, the 20152016 Summary Compensation Table and the other related tables and disclosure.”44A&B’s independent registered public accounting firm, the results of theyear-end audit of A&B, including the auditors’ report and audited financial statements. In this context, the Audit Committee has reviewed and discussed A&B’s audited financial statements with management, has discussed with Deloitte & Touche LLP the matters required to be discussed by applicable Public Company Accounting Oversight Board rules and, with and without management present, has discussed and reviewed the results of the independent registered public accounting firm’s audit of the financial statements.20152016 for filing with the SEC. The Audit Committee also has appointed, subject to shareholder ratification, Deloitte & Touche LLP as A&B’s independent registered public accounting firm for 2016.2017.20152016 werepre-approved in accordance with these policies.20152016 and 2014,2015, professional services were performed by Deloitte & Touche LLP (including affiliates) for A&B as follows:and 2014, the45reviews of the interim financial statements included in the Company’s Quarterly Reports on Form10-Q and consents for SEC registration statements were approximately $1,974,000 and $1,995,000, and $1,890,000, respectively.20152016 and 20142015 were approximately $188,000$407,000 and $105,000,$188,000, respectively, and were related primarily to consultation on financial accounting and reporting standards including those related to a potential REIT conversion and audit procedures for the Company’s standalone subsidiaries in 2016 and consultation on financial accounting and reporting standards and audits and agreed-upon procedures for the Company’s standalone subsidiaries in 2015 and to consultation on financial accounting and reporting standards and audits of the Company’s standalone subsidiaries in 2014.2015. The aggregate fees billed for tax services for the year ended December 31, 2014 was $199,000.20152016 and 2014.2015.96801-3440,96801- 3440, Attn: Alyson J. Nakamura, Corporate Secretary or by calling (808)525-8450. If you are a shareholder whose shares are held by a bank, broker or other nominee, you can request information about householding from your bank, broker or other nominee.201820172018 Annual Meeting of A&B must be received at the headquarters of A&B on or before November 14, 201613, 2017 in order to be considered for inclusion in the year 20172018 Proxy Statement and proxy.27, 2016.26, 2017. A&B’s Bylaws require that shareholder proposals made outside of Rule 14a-84614a- 8 under the Exchange Act must be submitted, in accordance with the requirements of the Bylaws, not later than December 27, 201626, 2017 and not earlier than November 27, 2016.26, 2017.By Order of the Board of Directors 
ALYSON J. NAKAMURA Corporate Secretary and Assistant General Counsel 
Using ablack inkpen, mark your votes with anXas shown in this example. Please do not write outside the designated areas. ☒ Electronic Voting Instructions Available 24 hours a day, 7 days a week! Instead of mailing your proxy, you may choose one of the voting methods outlined below to vote your proxy. VALIDATION DETAILS ARE LOCATED BELOW IN THE TITLE BAR. Proxies submitted by the Internet or telephone must be received by 11:00 PM, HST, on April 24, 2017. Vote by Internet Vote by telephone 
A Proposals — THE BOARD OF DIRECTORS RECOMMENDS A VOTE FOR PROPOSALS 1, 2, AND 3. 1. Election of Directors: 01 - W. Allen Doane 02 - David C. Hulihee Nominees: 03 - Stanley M. Kuriyama ☐ ☐ ☐ For AllEXCEPT- To withhold authority to vote for any nominee(s), write the name(s) of such nominee(s) below. For Against Abstain For Against Abstain 2. PROPOSAL TO APPROVE THE ADVISORY RESOLUTION RELATING TO EXECUTIVE COMPENSATION ☐ ☐ ☐ 3. PROPOSAL TO RATIFY THE APPOINTMENT OF DELOITTE & TOUCHE LLP AS THE INDEPENDENT REGISTERED PUBLIC ACCOUNTING FIRM OF THE CORPORATION ☐ ☐ ☐ B Authorized Signatures — This section must be completed for your vote to be counted. — Date and Sign Below Signature 1 — Please keep signature within the box. Signature 2 — Please keep signature within the box. 1 P C F 02J3MA 
BoardCorporation to be held on Tuesday, April 25, 2017, and at any adjournments or postponements thereof, on the matters set forth in the Notice of Directors/s/ Alyson J. NakamuraALYSON J. NAKAMURACorporate SecretaryMeeting and Assistant General Counsel4748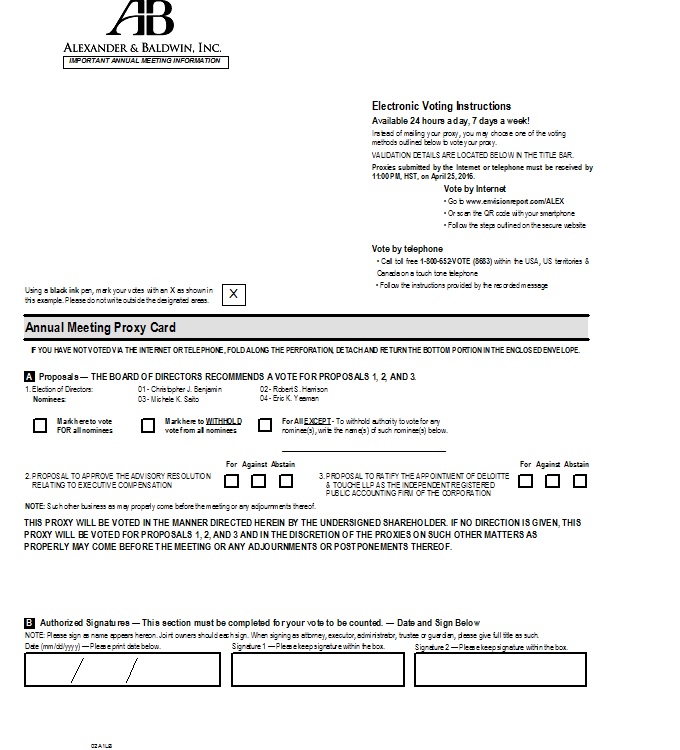
49 Proxy Statement, as stated on the reverse side.
50


